Key findings
The goal of rent stabilization is to set rents at the minimum level such that landlords can effectively maintain their properties.
- Rent regulation corrects overdeveloped landlord market power caused by insufficient housing supply—a serious and documented market failure.
Rental housing in New York City has become less affordable over time:
- Inflation-adjusted median rent (in 2023 dollars) jumped from ~$1000 in 1993 to ~$1,500 in 2023.
- Rent stabilization has been critical for maintaining the most affordable housing stock and will be necessary to shift the distribution of rental costs back to a more sustainable and affordable equilibrium, such as New York City had in 1993.
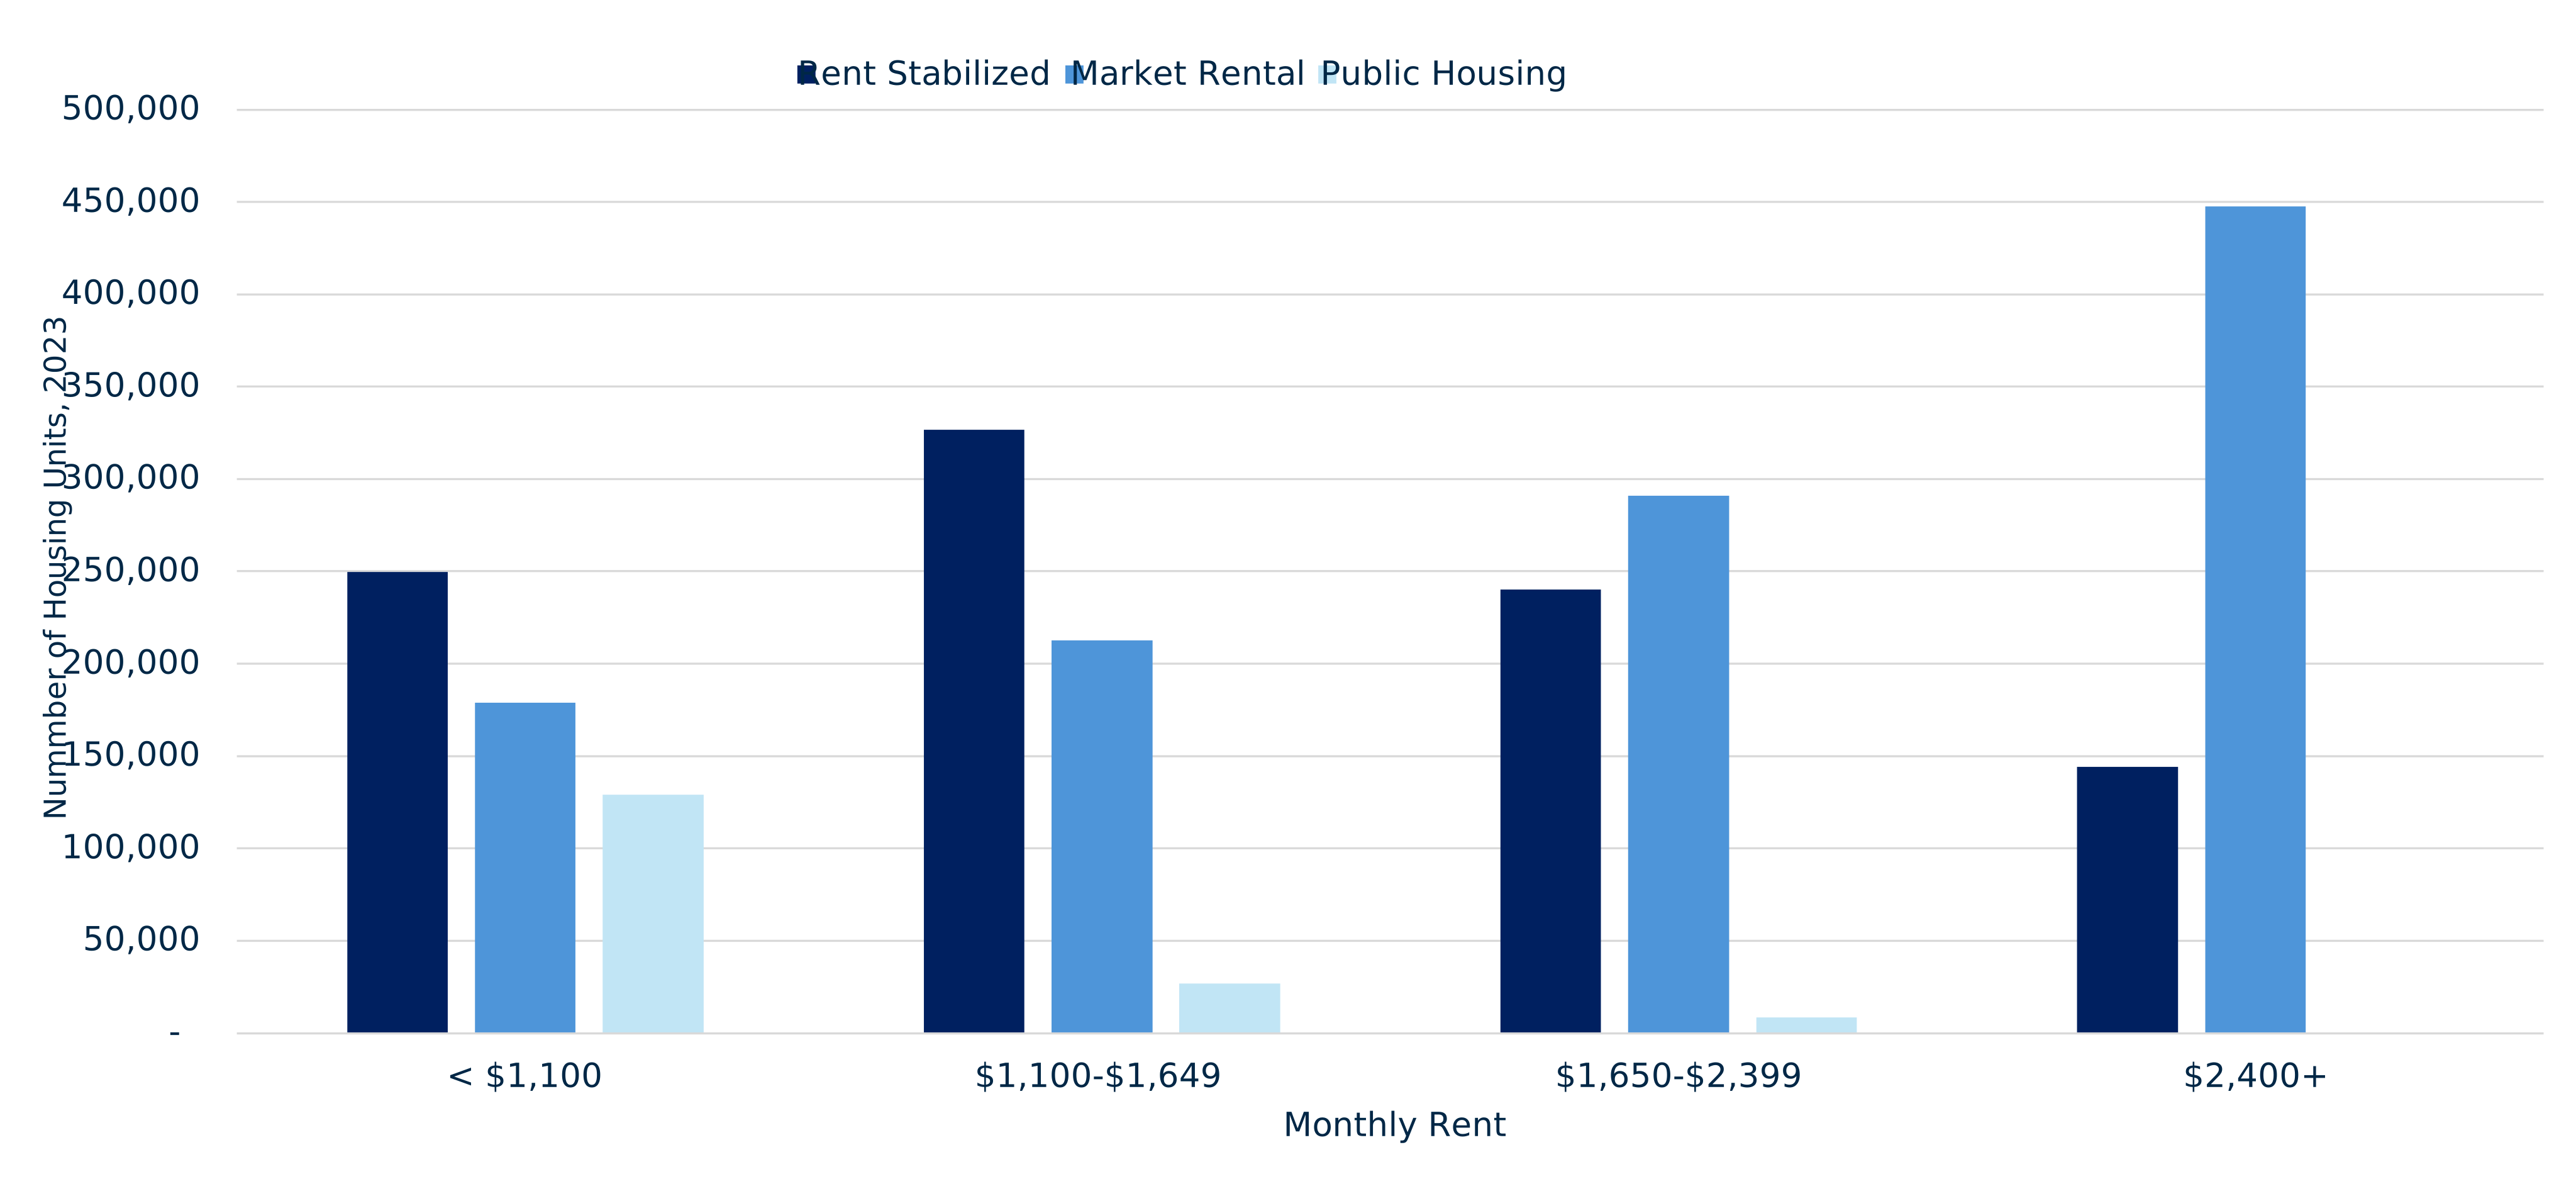
- In 2023, 60% rent-stabilized apartments cost less than $1650/month, while fewer than 35% of market-rate apartments rented below that rate.
The Consumer Price Index (CPI) should not be used to guide rent increases, as it is a circular metric—New York City CPI inflation is largely driven by housing inflation in the market-rate rental market.
New York City’s rent-stabilized landlords remain broadly in sound financial health.
- The number of rent-stabilized buildings in distress is less than 10 percent and has fallen in recent years.
- Over the past twenty-five years, average net operating income has increased by 56.6 percent after adjusting for inflation.
There are two kinds of distressed rent-stabilized landlords:
- Speculators who bought before the 2019 Housing Stability and Tenant Protections Act, expecting to deregulate units. (These purchases were bad bets that may result in losses, but these buildings should not be considered fundamentally distressed.)
- Those with HPD-financed projects whose loans assume 2 percent annual rent growth.
Stabilization is not the major driver of increased physical distress.
- Market-rate and stabilized units both saw pandemic-related maintenance backlogs, but long-term trends show building quality for both is improving.
Introduction
On March 26, 2026, Acting Executive Director and Chief Economist Emily Eisner testified on behalf of the Fiscal Policy Institute at the initial hearing of the New York City Rent Guidelines Board (RGB) after the RGB presented its 2026 Income and Expense Study.
The Rent Guidelines Board is an independent body that determines rent adjustments for approximately one million rent-stabilized residential units in New York City. The board’s decisions are determined by the economic condition of housing across the city, cost-of-living information, rates of vacancy and housing supply, and the ability of tenants to pay rent. The board considers research conducted by city and federal officials and public testimony from tenants, landlords, and outside experts. The hearings have received increased public attention in recent months, as the feasibility of freezing the rent for rent-stabilized tenants was a major topic of debate in New York City’s mayoral election.
FPI’s testimony covered:
- A framework for rent stabilization policy
- Housing market conditions in New York City
- RGB adjustments relative to inflation over the 1977–2025 period
- The financial health of rent-stabilized buildings
- Mortgage payments as a major component of financial distress
- The measurement of physical distress
A written summary of Dr. Eisner’s testimony is available below.
Video: FPI Testimony before the RGB →
1. Rent Stabilization Framework
New York City’s system of rent stabilization is meant to fulfill two goals: maintaining the city’s stock of rent-regulated housing and minimizing tenant displacement, allowing as many people as possible to continue living in their homes. The goal of rent stabilization is to set stabilized rents at the minimum rate such that landlords can effectively maintain their properties in a state of good repair. This policy objective can be expressed as the optimization
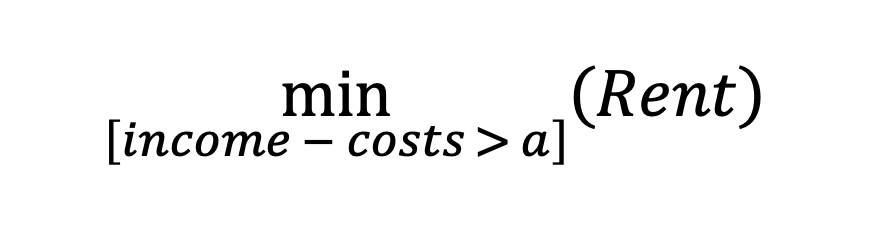
where a refers to the minimal net income rate where good building repair can be maintained. Note that this is distinct from balancing the profits of landlords against the welfare of tenants; keeping the net income of landlords sufficiently positive (on average over time) to maintain their buildings effectively is a constraint but not the object of optimization itself. Rather, the objective of the policy is to minimize rent increases, subject to cost constraints.
Further, rent regulation can be understood as a price stabilization policy designed to address a particular market failure—overdeveloped landlord market power resulting from insufficient housing supply. Increasingly strong evidence shows that New York City’s housing stock—and much of the country’s—is price inelastic ↓, as stark rises in rents over recent decades have resulted in little increase ↓ in New York City’s rental housing supply →. Meanwhile, the consumer price index (CPI) for rental price of primary residence has grown → by 83.6% over the same period.
When housing supply is constrained, high demand puts upward pressure on prices, causing large rent increases. Tenants have little choice but to pay the exorbitantly high rents set by a market that does not appropriately increase supply. Rent stabilization policy is meant to correct for the consequent distortion in rental costs by restricting the amount that landlords of rent-stabilized units may charge. If New York City wishes to cultivate a housing stock that is sustainably affordable for its residents, the near-term goal of using price stabilization to correct for price distortions should be paired with the long-term goal of correcting the housing supply shortage through private and public housing construction.
2. Housing Market Conditions
Figure 1 demonstrates the distortions in the price point of New York City’s rental housing over the past thirty years. It details the inflation-adjusted monthly rent distribution in New York City in 1993 and 2023.
Fig. 1. Distribution of monthly rent for New York City apartments, inflation adjusted
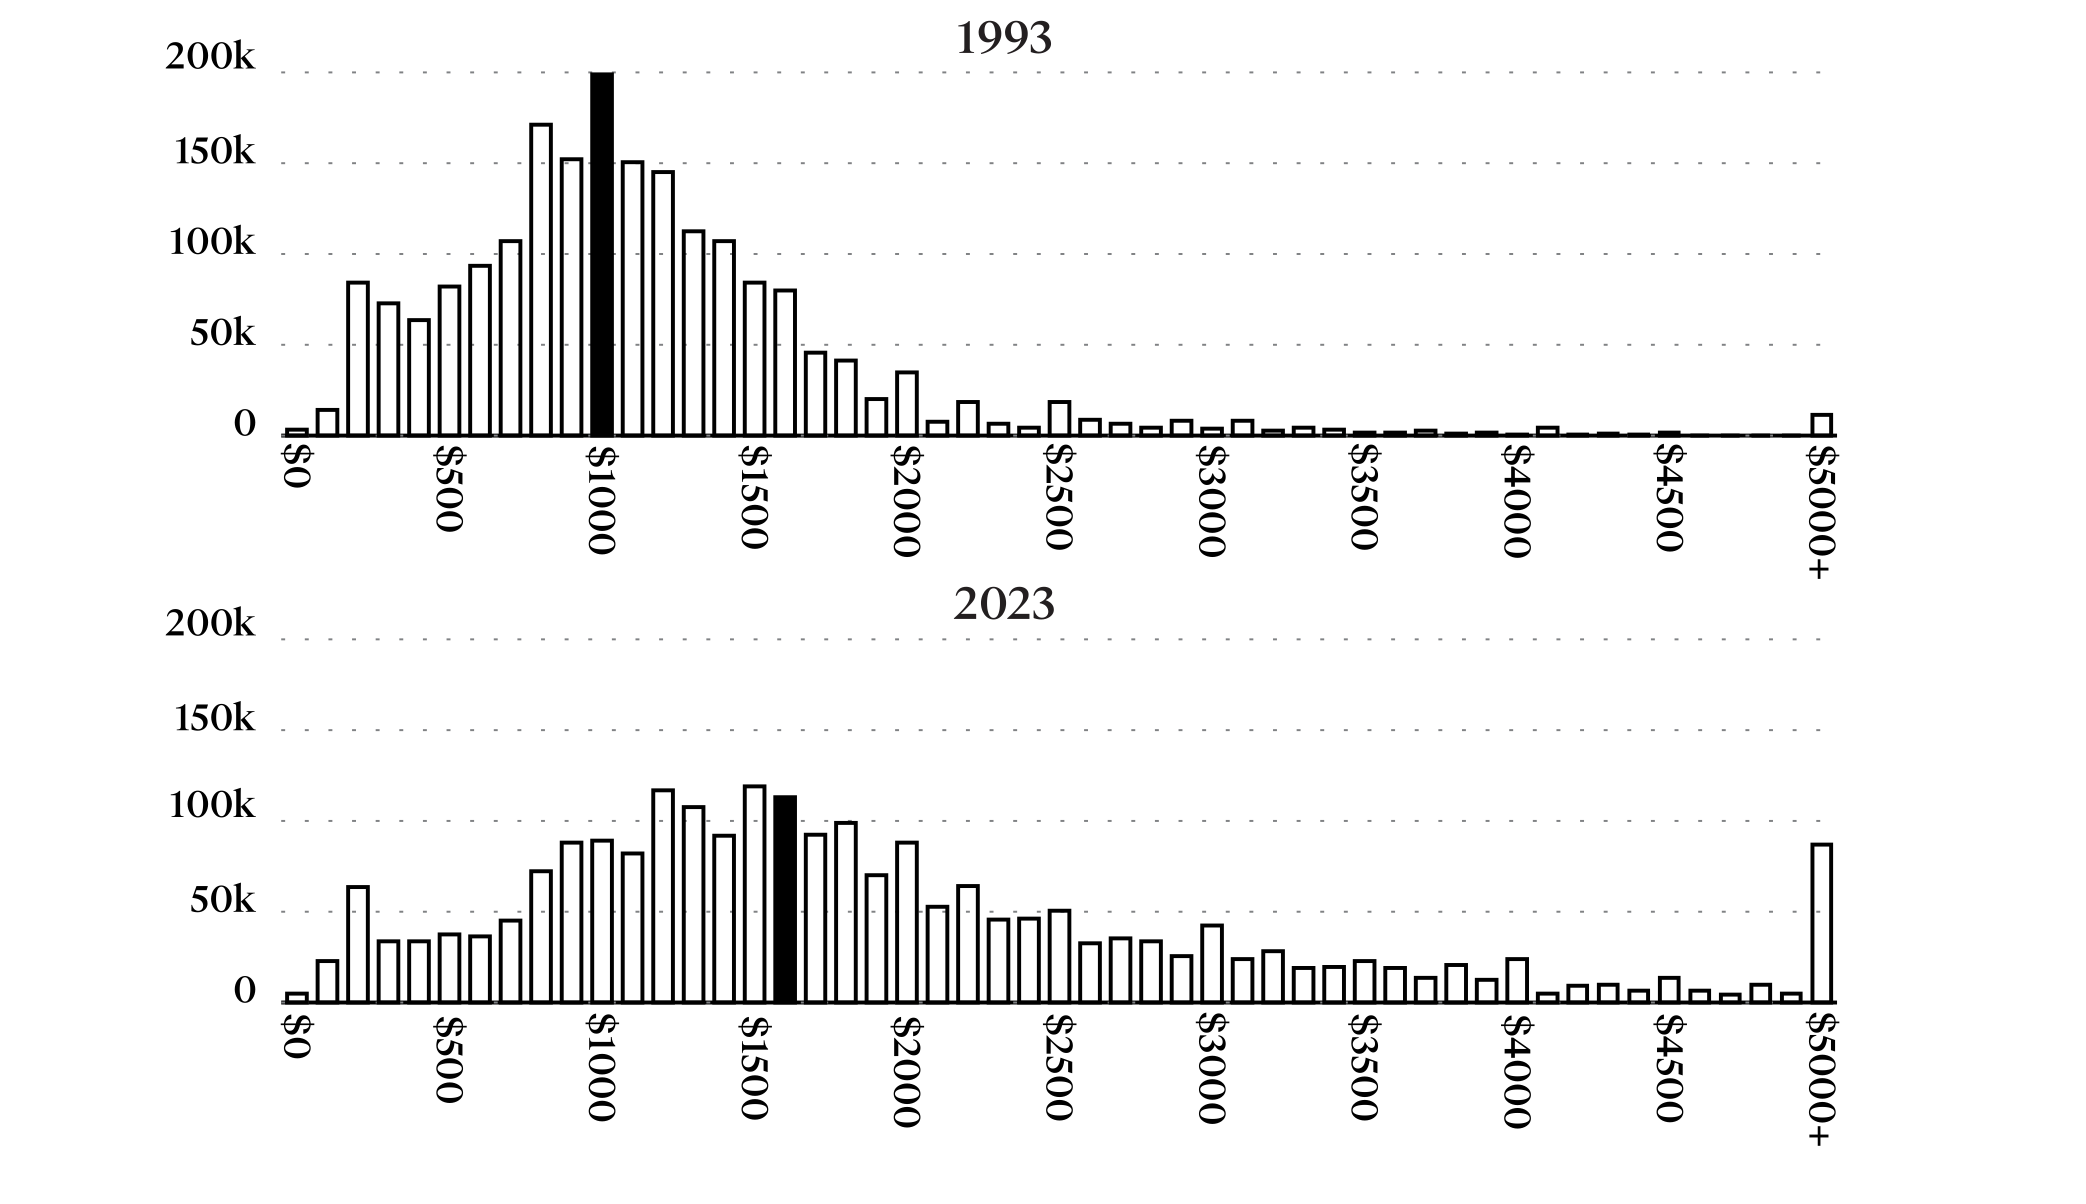
The median inflation-adjusted rent rose substantially between 1993 and 2023, from just about $1,000 per month to over $1,500 (in 2023 dollars). More concerningly, the entire distribution of rents has shifted enormously. Rather than clustering tightly around the median rental value, as in the 1993 graph, rents in 2023 were heavily weighted towards luxury units, with nearly one hundred thousand units charging rents of more than $5,000 per month.
Several tools will be necessary to reverse this trend, especially building new housing in New York City and the surrounding suburbs. However, because new construction takes time, rent stabilization policy can help preserve low-cost housing in the context of an overheated market.
To do so, rent regulation should be used in the medium term to both lower inflation-adjusted median rent and increase the ratio of low- to high-cost rental housing. Note that if the RBG aims to lower inflation-adjusted rent over time (to more closely match rent distribution circa 1993), its annual rent increases will need to be lower than CPI for a period of time. This point will be developed in section three.
As rental prices have grown aggressively in response to inelastic supply and rising demand, the rent-stabilized housing stock has been essential to mitigating the above shift in rent distribution. Figure 2 shows that as of 2023 a plurality of rental units costing less than $1,650 per month are rent-stabilized.
Fig. 2. Rental apartments in New York City by type and monthly rent, 2023

3. Rental Costs Relative to Inflation
For the past fifty years, the Rent Guidelines Board’s annual increases for one-year rental contracts have closely followed annual increases in the Consumer Price Index in the New York City metropolitan area. This close correlation can be seen in figure 3. Note that the RGB has not made this choice explicit, nor is the RBG legally mandated to take CPI into account; rather, it appears that CPI inflation in the NYC metropolitan area (including shelter cost increases) has been an implicit guide for the RGB’s one-year rent increases.
Fig. 3. RGB 1-year rent increases have closely followed the CPI with shelter costs included
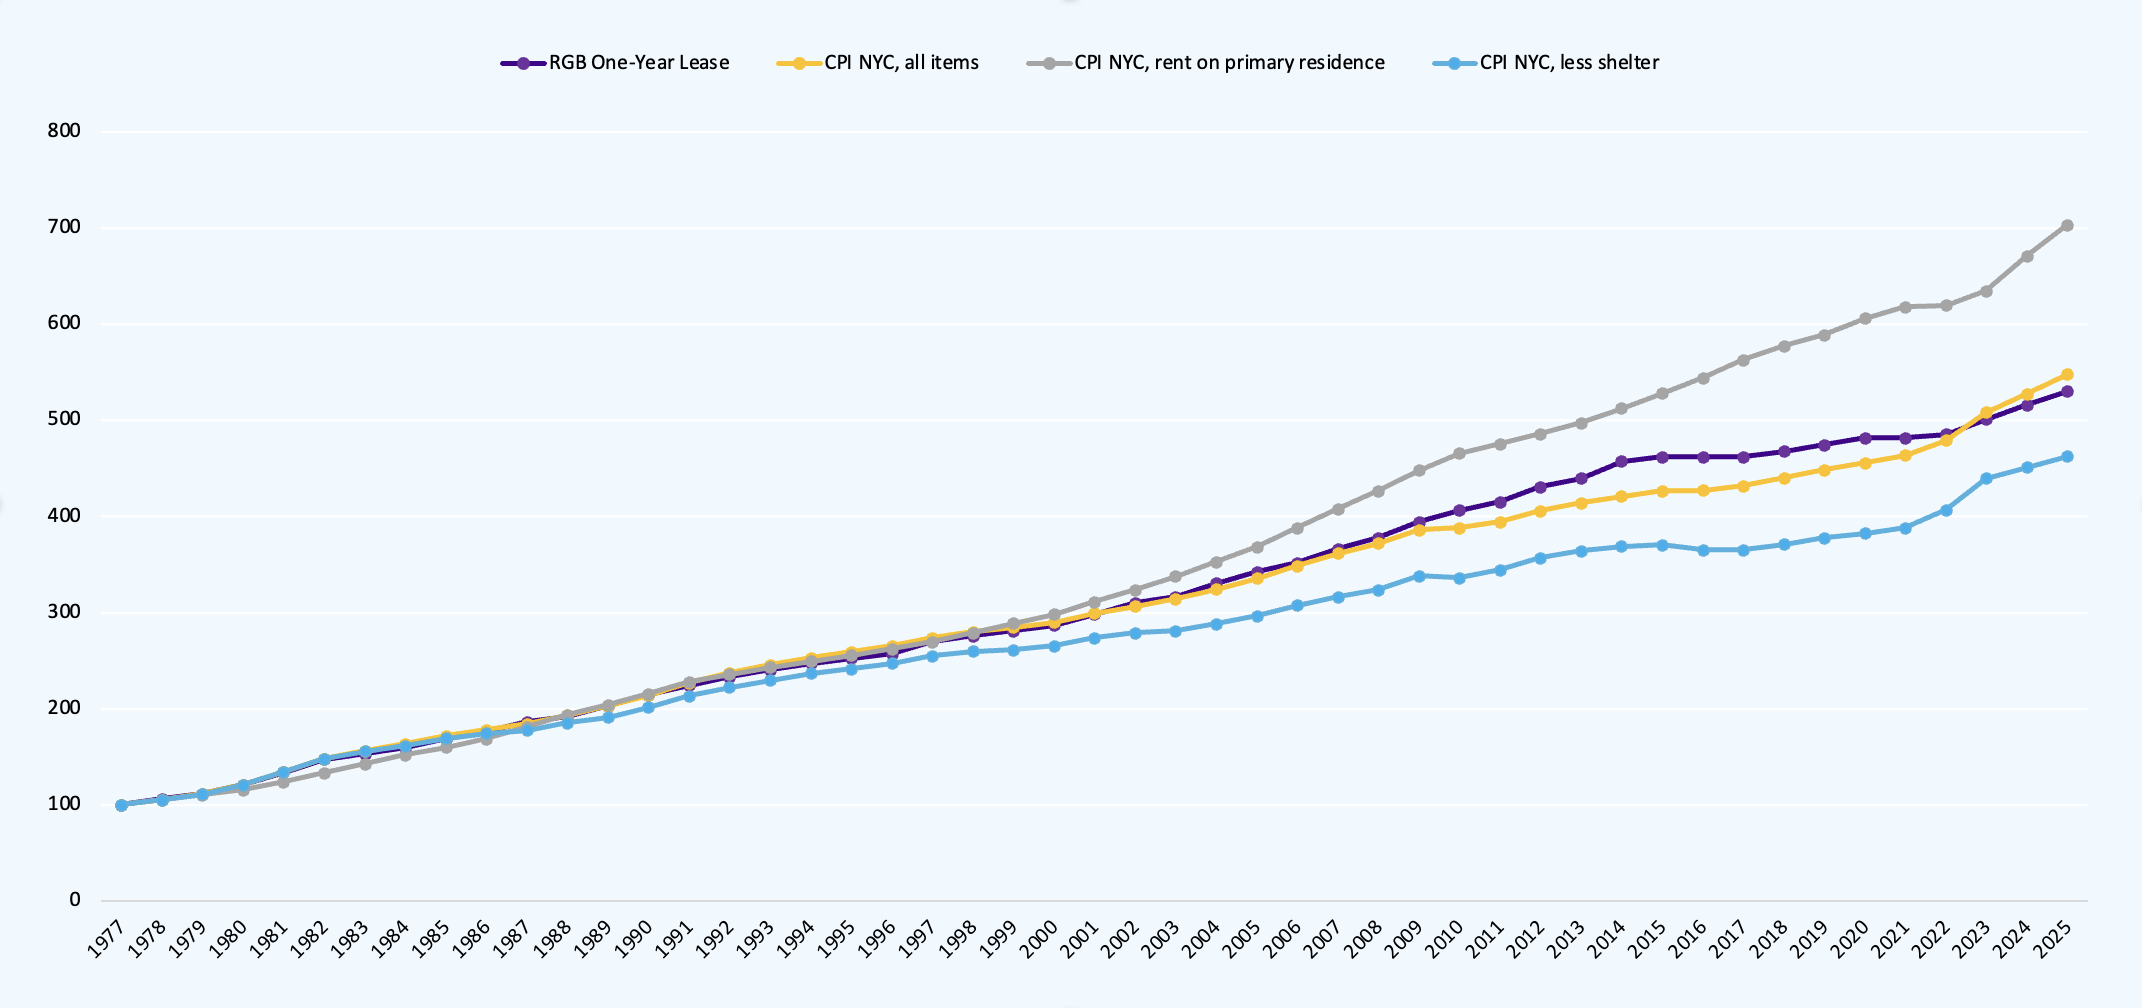
Allowing overall CPI inflation to guide rent-stabilized unit rent increases may at first glance appear as a sensible policy choice: One could argue that rents must keep up with inflation so that landlords can afford to maintain buildings. But this misses a key fact: CPI inflation in New York is itself driven largely by housing inflation.
CPI itself includes rent of primary residence, and housing inflation accounts for about 35 percent of CPI as a whole →. Allowing New York City rent-setting to be guided by a measure of price increases that so heavily includes market rents undermines the policy’s goal of being a corrective for price distortions in the housing market. When used this way, CPI becomes a circular metric. Rather than serving to bring CPI derived from rent closer in line to CPI less shelter, the RGB’s method of pegging annual increases to overall CPI keeps the rent inflation rate elevated above that of other commodities and contributes to the increasing share of income New Yorkers must spend on rent.
For example, figure 3 plots CPI less shelter costs. When shelter costs are not included, the RGB’s increases over time outpace inflation. The RGB has on average set rental increases 0.3 percentage points higher than CPI excluding shelter costs. While this number may seem small, over decades the effect has compounded to produce a sharp divergence between rental increases and CPI excluding shelter, exacerbating New York City’s housing affordability crisis by forcing renters to spend ever greater fractions of their income on housing.
That is not to say that RGB could or should ignore inflation; landlord costs do rise over time and rent increases must account for that over the long run. CPI-measured inflation, however, is a poor guide for RGB, since it largely reflects the dynamics of New York’s dysfunctional and inflationary market-rate rentals rather than the costs landlords pay to maintain their buildings.
4. Building fundamentals of rent-stabilized housing remain stable
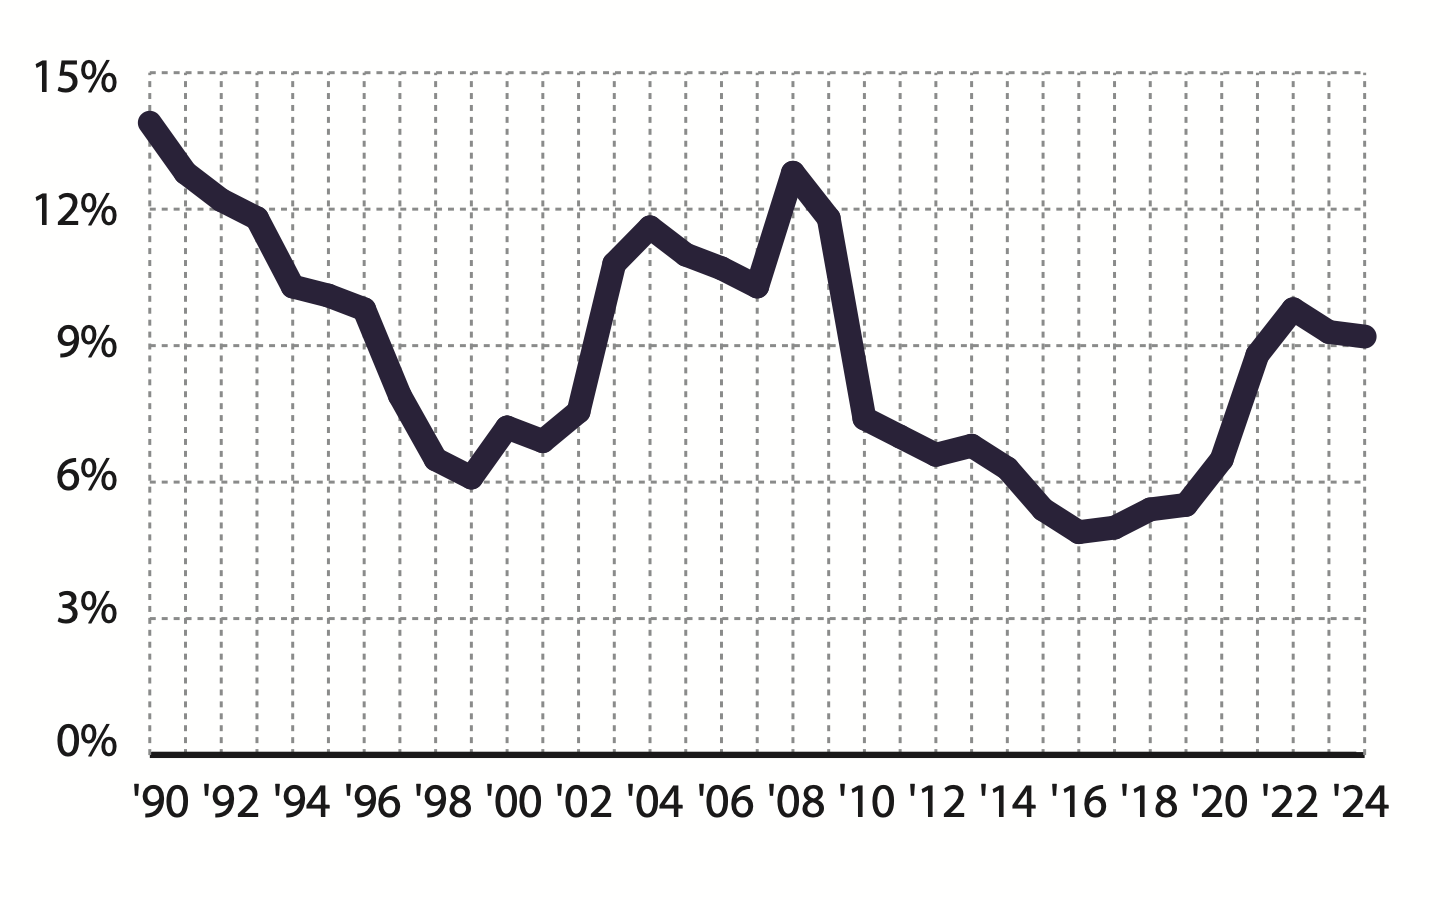
Over the past twenty-five years, the share of distressed rental properties in the rent-stabilized stock (meaning properties with negative NOI) has shown a decreasing trend. Over the same period, average net operating income has *increased by*56.6 percent after adjusting for inflation. While this number would seem to evidence a prosperous period for New York City’s rent-stabilized landlords, this metric should be considered with caution. The Real Property Income and Expense (RPIE) data set is New York’s major source for information about rent-stabilized housing. Because RPIE data only captures buildings containing any number of rent-stabilized units (rather than the units themselves), and because many buildings have both stabilized and market-rate units within them, this increase in NOI may represent a decrease in the ratio of stabilized to nonstabilized units in buildings overall, rather than an increase in income derived from stabilized units. More granular data will be required to differentiate overall revenue and composition effects.
Fig. 4. Share of buildings containing rent-stabilized units for which NOI<0
One may also assess the financial health of rent-stabilized housing through disaggregating the stabilized stock by ratio of stabilized to non-stabilized units. Stabilized buildings are a diverse population, largely composed of buildings built before 1974 (sometimes called “legacy buildings”) but also including buildings built after 1974 for which developers have made agreements with agencies such as New York City’s Housing Preservation and Development (HPD) to create means-tested and rent-stabilized units in exchange for tax abatements or direct subsidy. Both because of the heterogeneity of legal frameworks for stabilization and because many legacy stabilized units were deregulated via vacancy decontrol between 1994 and 2019, apartment buildings in New York City can and often do range from 0% to 100% stabilized units.
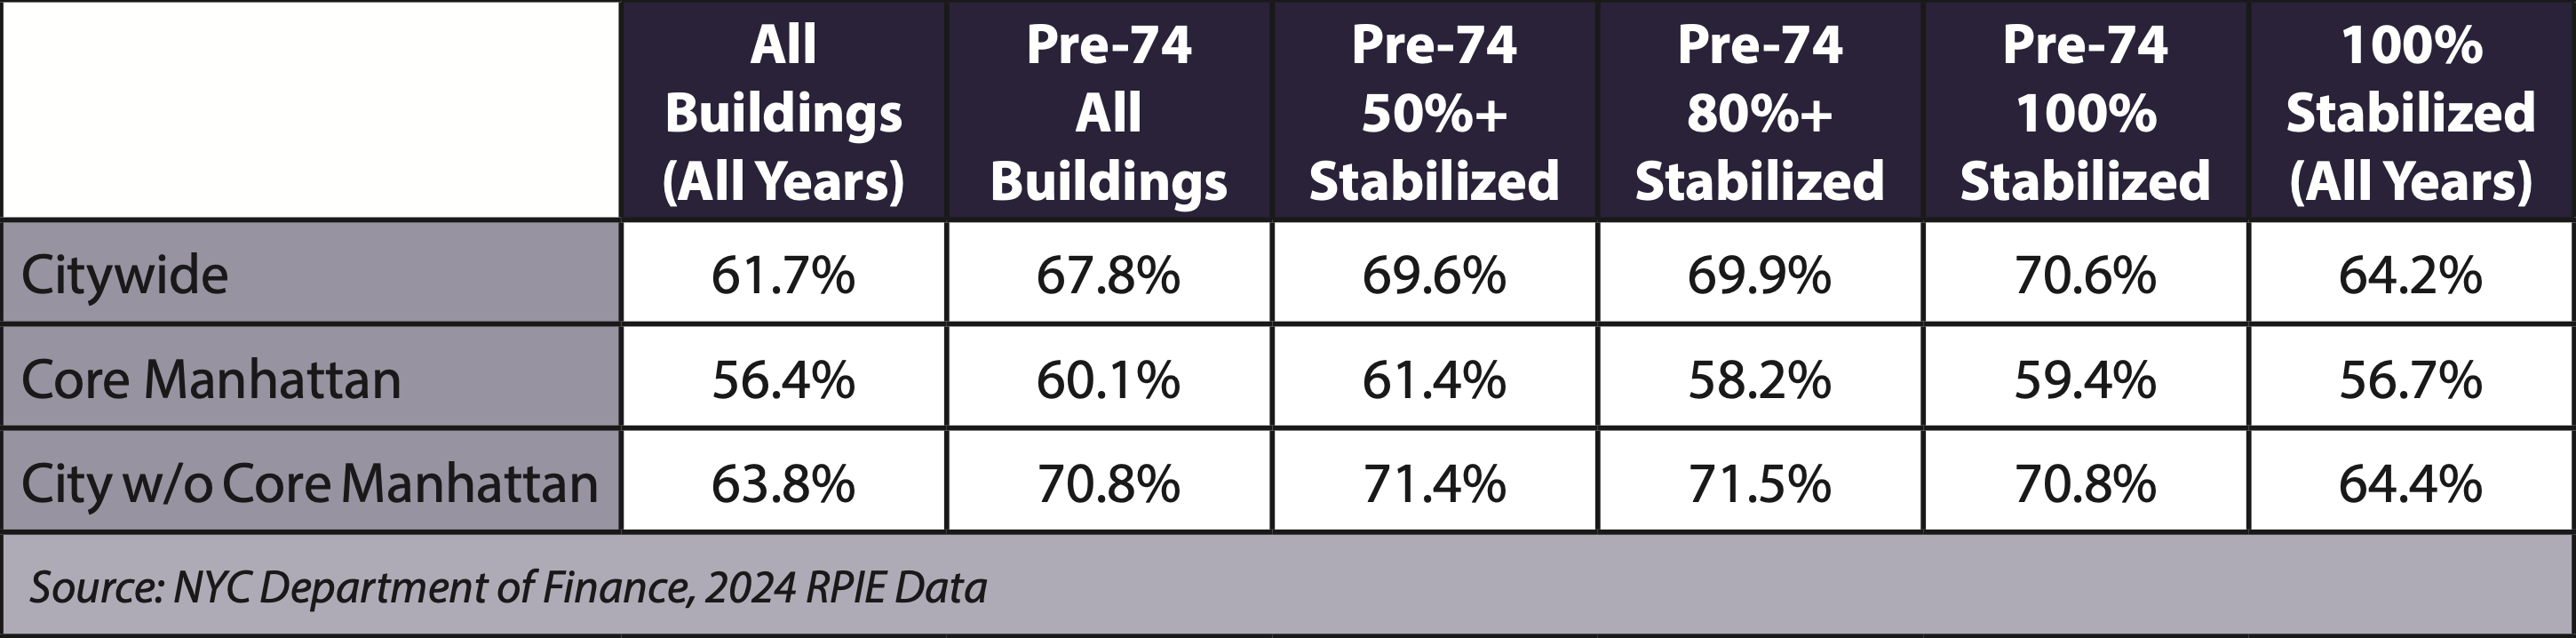
Table 1 demonstrates extremely consistent cost-to-income ratios of around 70 percent in legacy stabilized buildings citywide, regardless of the stabilized-to-market unit ratio within them.1 The consistency of this 70 percent ratio across buildings with varying rates of stabilization indicates that the concentration of more rent-stabilized units is not placing severe burden on the buildings. In other words, if rent-stabilized units were cause for financial distress (costs greater than income), we would expect buildings with more stabilized units to have higher overall cost-to-income ratios.
Table 1. Cost-to-Income ratios are stable across buildings with varying proportions of rent-stabilized units
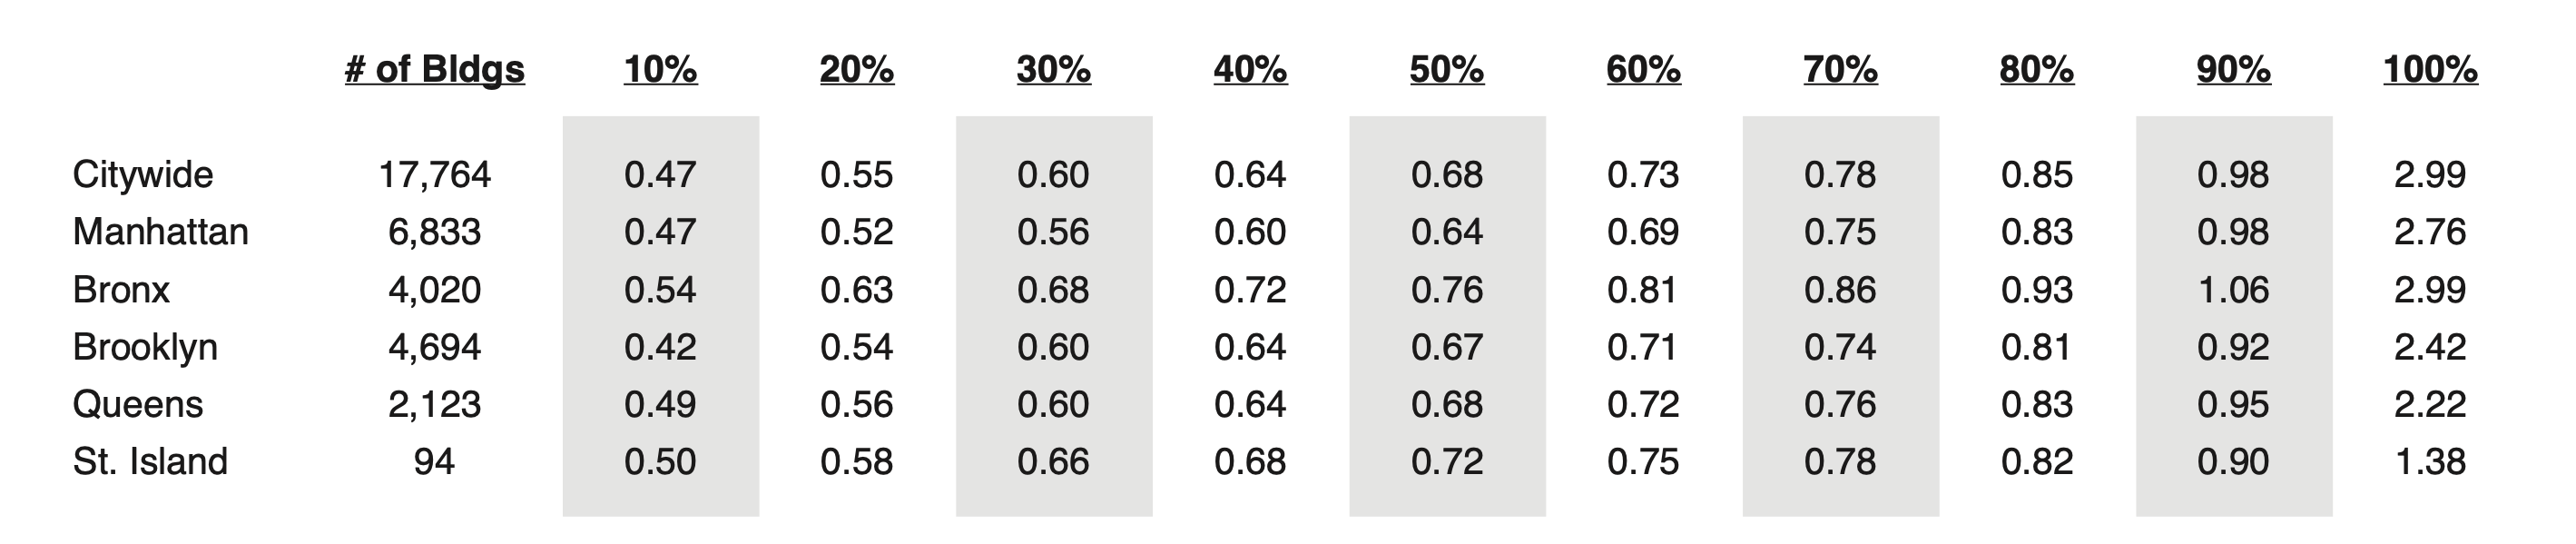
Further, cost-to-income ratios less than 1 (costs smaller than incomes) are the norm across all but the top decile of buildings, meaning that more than 90 percent of New York City’s rent-stabilized stock is not currently financially distressed.
Table 2. Distribution of cost-to-income ratios by decile in 2024
5. The Issue of Mortgage Payments
While net operating income is generally healthy in New York City’s rent-stabilized buildings, debt burden has emerged as a serious issue for many rent-stabilized landlords. Enterprise Community Partners, a national nonprofit that specializes in developing and maintaining low income designated housing, published a report on their own New York State-based Low Income Housing Tax Credit housing portfolio last year that identifies more than half of all units as having been in financial distress since 2022. This is an alarming number; it is a result their decision to account for mortgage payments in their measure of financial distress.
Fig. 5. Report from Enterprise Community Partners raises alarm bells
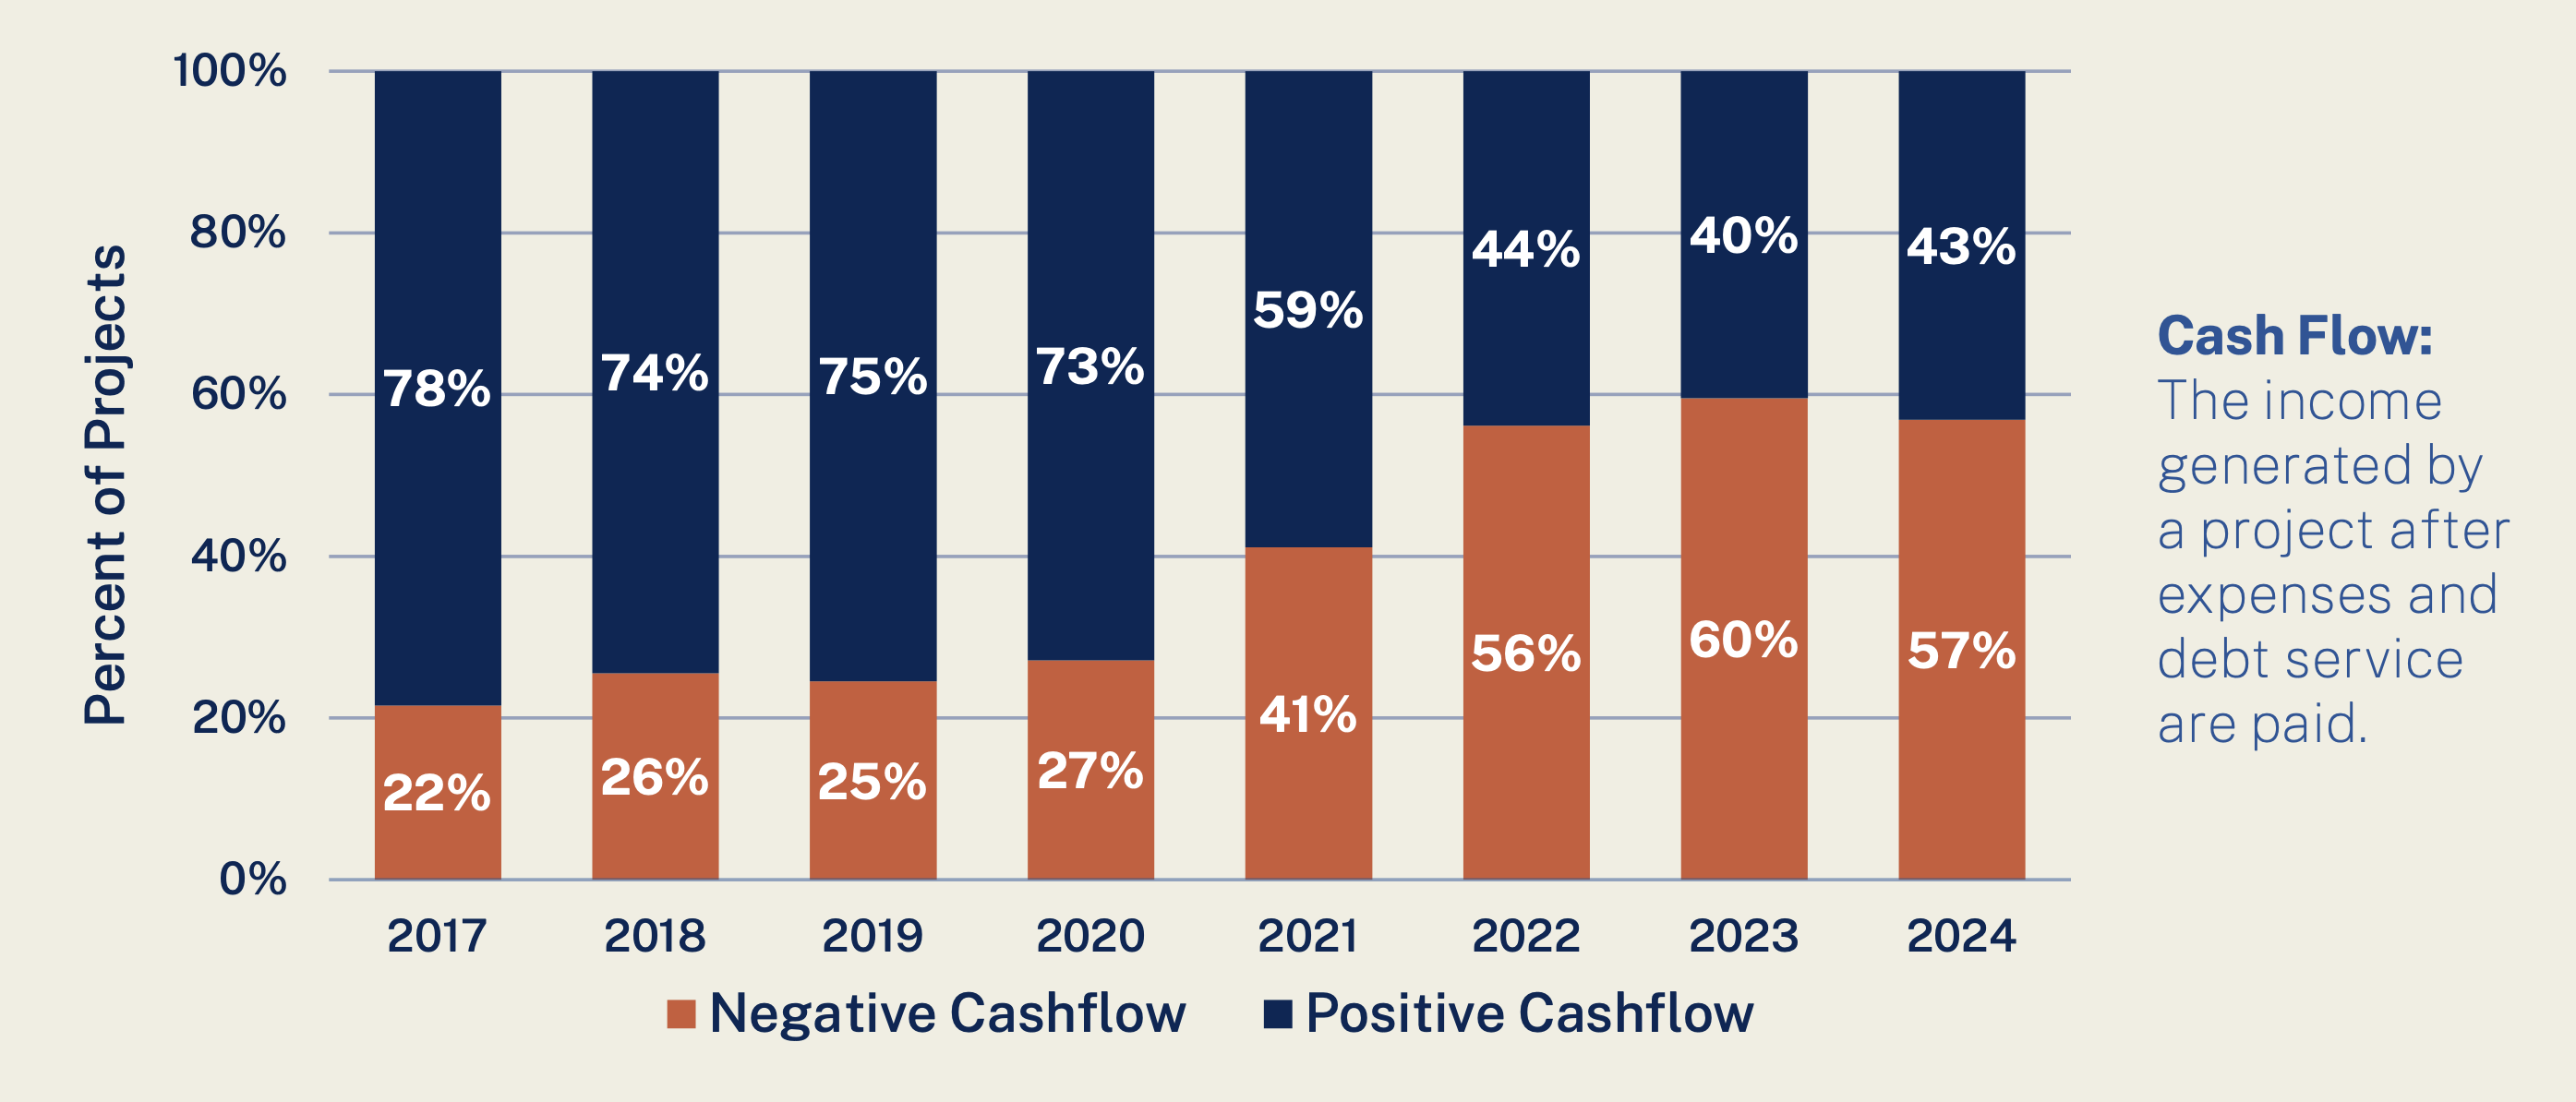
The distinction between NOI and “cash flow” (which is equal to NOI plus the impact of mortgage payments) in figure 5 explains why many landlords complain that they are losing money even though the RPIE data discussed above show healthy and growing operating incomes for rent-stabilized buildings. While the buildings themselves are readily capable of generating positive net income, landlords with high mortgage costs may not earn enough from these buildings to meet their debt service.
Why do some rent-stabilized landlords in New York today find themselves burdened with excessive mortgage costs? Mortgage costs reflect the valuation at which a building was financed, as well as the interest rate of the loan. In the case of New York City’s rent-regulated housing stock, there are two types of building-owners facing burdensome mortgage costs: speculative investors who made “bad bets” regarding their ability dramatically increase rents by deregulating units, and proprietors of HPD-financed affordable housing developments built in the last twenty years—as Department financing assumed consistent 2 percent growth in rents.
This first set of buildings were purchased at valuations that included a plan to deregulate units and raise rents. In New York, many landlords purchased rent-stabilized buildings in the years before 2019 at much higher valuations than were justified by existing rents. They did so on the assumption that they could deregulate units in their buildings over time and pay mortgage interest by converting the portfolio to market-rate and charging much higher rents in the long term. When the Housing Stability and Tenant Protection Act of 2019 made unit deregulation illegal, landlords found themselves burdened by more debt than could be serviced with existing rents. This is the “bad bet” source of problematic debt burden → among rent-stabilized landlords →.
The second set of buildings facing burdensome financing costs are recently built affordable housing developments that borrowed money from the Department of Housing Preservation and Development. HPD’s loan terms assumed 2 percent annual rent increases over the term of the loan, and this increase was factored into developers’ financing plans. As a result, these landlords find themselves problematically debt burdened by contractual obligation in years where the RGB does not raise rents by at least 2 percent.
Because both sources of financial distress for rent-stabilized landlords emerge from the conditions of a building’s financing rather than the fundamental capacity of buildings to generate positive NOI, policymakers can resolve the problem of landlord debt burden at the level of refinancing and cost relief, rather than immediately placing the burden on tenants through raised rents. Because financing costs have become a more generalized concern in the development of almost all types of housing, lowering the cost of construction loans and other instruments for financing low-cost housing should be a policy priority.
Landlords may need to sell “bad bet” buildings that were purchased at speculative valuations, or refinance these buildings at more appropriate valuations. In the case of HPD-financed affordable housing developments, however, the City should consider adjusting debt terms to reflect actual rent growth in recent decades. In neither case would it be appropriate for the RGB to increase rents to cover debt service in buildings where rents are already more than sufficient to cover building operations and maintenance. The City may adopt strategies of cost containment and devise new pathways for landlords to refinance high debt burden mortgages.
6. Concerns regarding the measurement of physical distress
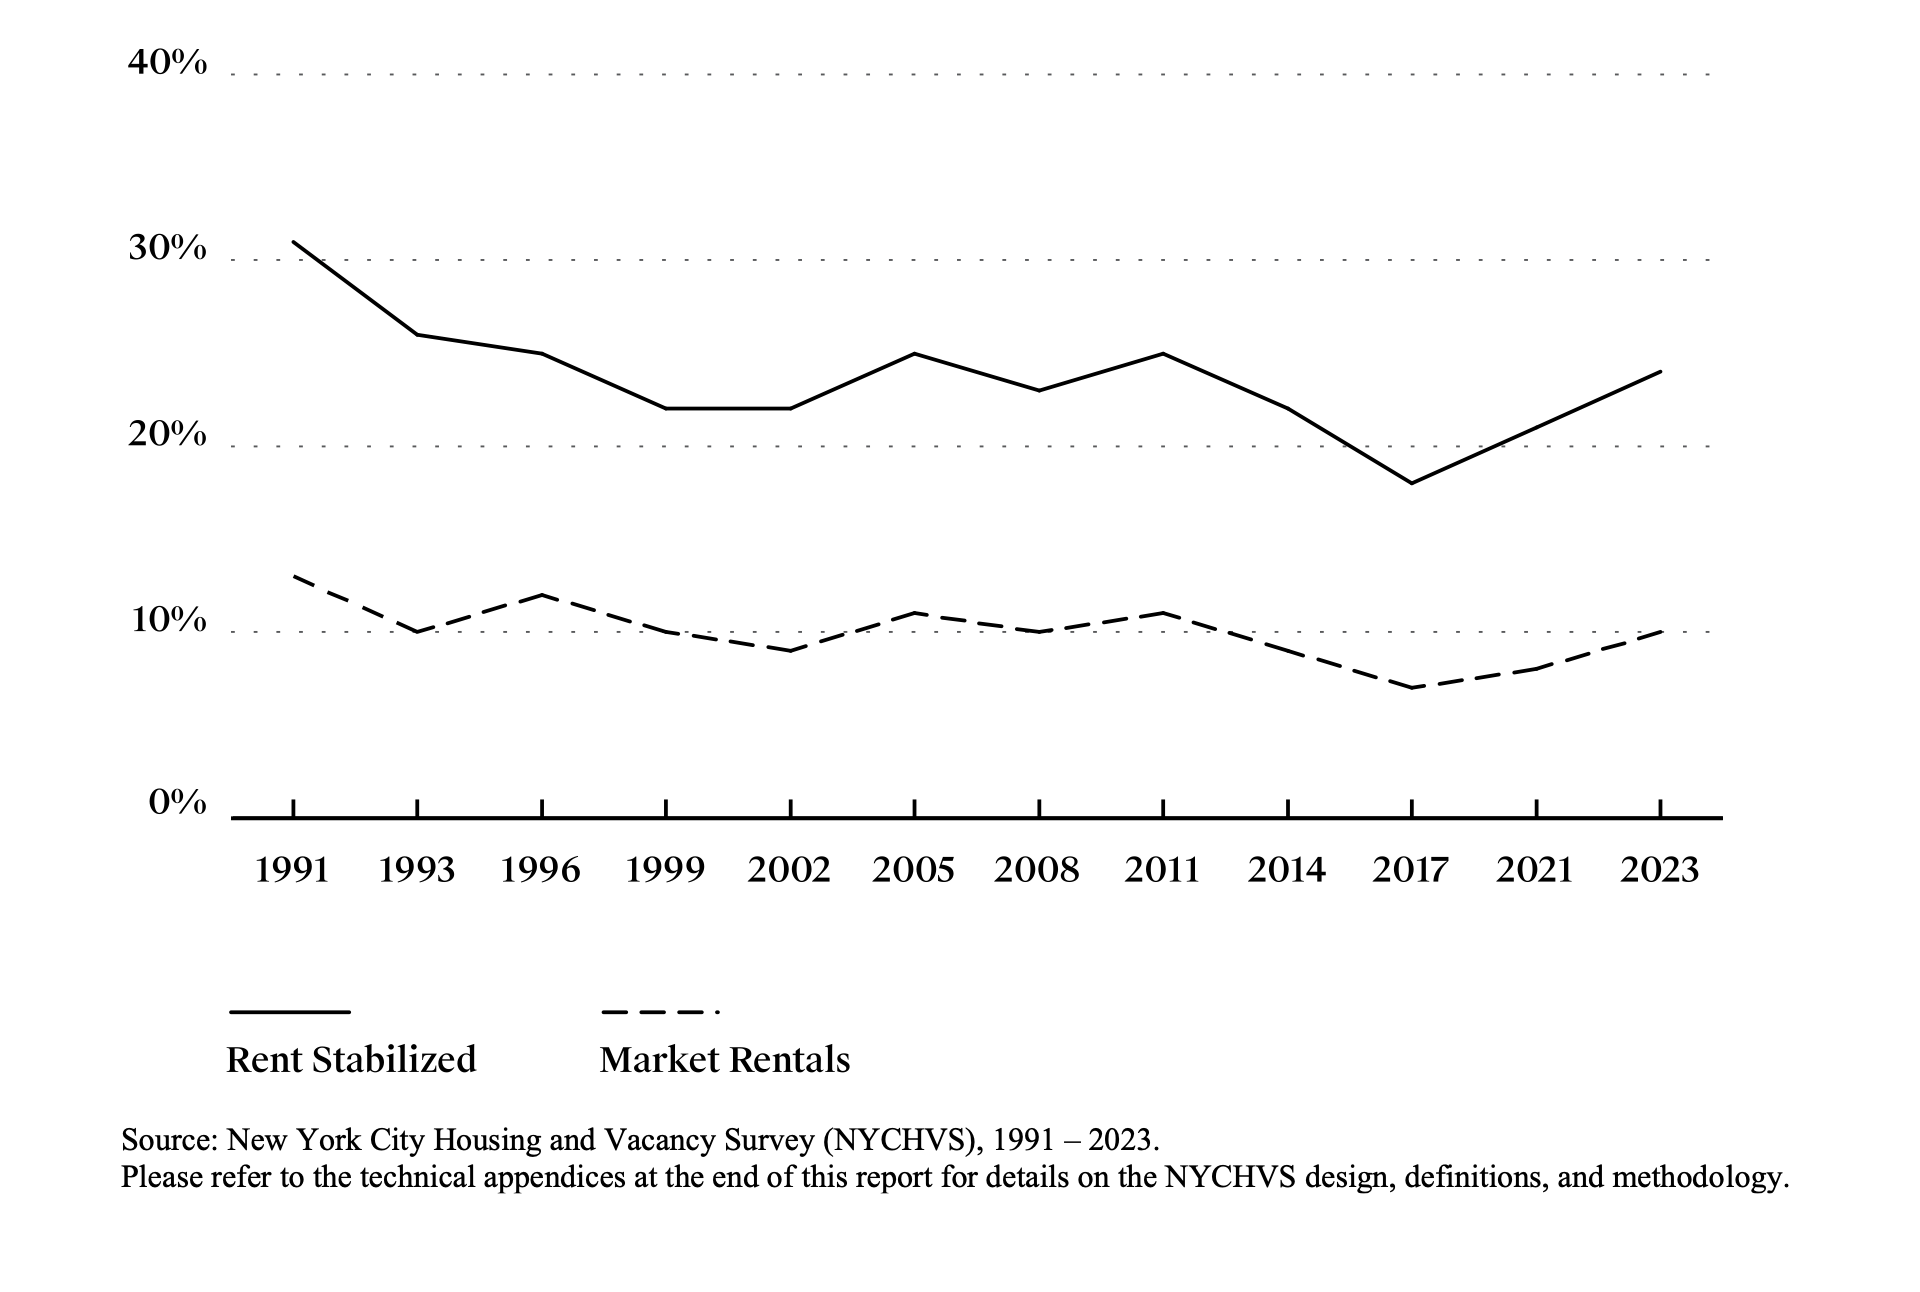
A final word on the question of physical distress. As other presenters at the RGB meeting, including representatives of the Furman Center and the Community Service Society, have noted, data on physical distress in New York City’s housing are based on the Housing Vacancy Survey (HVS). While rates of severe building distress have accelerating since 2017, analysis of the HVS demonstrates that this increase is more or less even between stabilized and market-rate housing—implying that stabilization is not the major driver of increased physical distress. This rise in rates of distress is not consistent in the long run. Rather, the Covid-19 pandemic and subsequent high inflation period are to blame for delayed maintenance in both rent regulated housing and market-rate housing. Over a longer time horizon, we see building quality improving in both market and rent-regulated units. These trends are depicted in figure 6.
When assessing where to set yearly allowed rent increases, the RGB looks at standard forms of evidence including case studies and testimonies from landlords and tenants concerning the physical condition of rent-stabilized housing. The testimony is usually dire, as both groups describe housing that is unsafe and in desperate need of repair. The RGB should remain open to anecdotal testimony but handle it with some caution; we lack high quality data on physical distress in stabilized buildings and the available data imply that recent increases in physical housing distress extend across both the stabilized and market-rate rental stock.
Fig. 6. Units Reporting 3+ Housing Problems for Rent-Stabilized Units and Market Rentals: 1991–2023
Conclusion
Current political and economic dynamics indicate the New York City needs strong tenant protections that minimize displacement risks, as rents rapidly outpace overall inflation within the city and the US economy faces great uncertainty, including the possibility of an economic recession. At the same time, the financial fundamentals of New York City’s buildings are strong across building types, indicating room for the City to hold rents steady. While this room exists in the short term, it does not diminish the urgent need for New York State and City entities to add to the supply of housing alongside the expansion of rent regulation to a greater share of the City’s rental units. In the near-term, it will be important to augment the necessary rent freeze with cost-containment measures related to insurance, utility, and financing costs, as these expenses pose the greatest threat to the net operating incomes of New York City’s rent-stabilized buildings.