On July 10, the New York State Comptroller’s office unveiled a dashboard → tracking the 2015–24 in- and outmigration patterns of state income tax payers by both income level and filing status. This release coincided with a spate of public commentary— from a recent study → by the Citizen’s Budget Commission to remarks → from US representative Tom Suozzi—claiming that high taxes on the state’s highest earners drive the wealthy out of New York and into fast-growing low tax states.
FPI research, however, demonstrates that this claim is not empirically justifiable. A more granular look into the data shows that households in the top 1% leave New York at the lowest rates and that households impacted by the state’s two most recent tax increases showed no heightened outmigration in response.
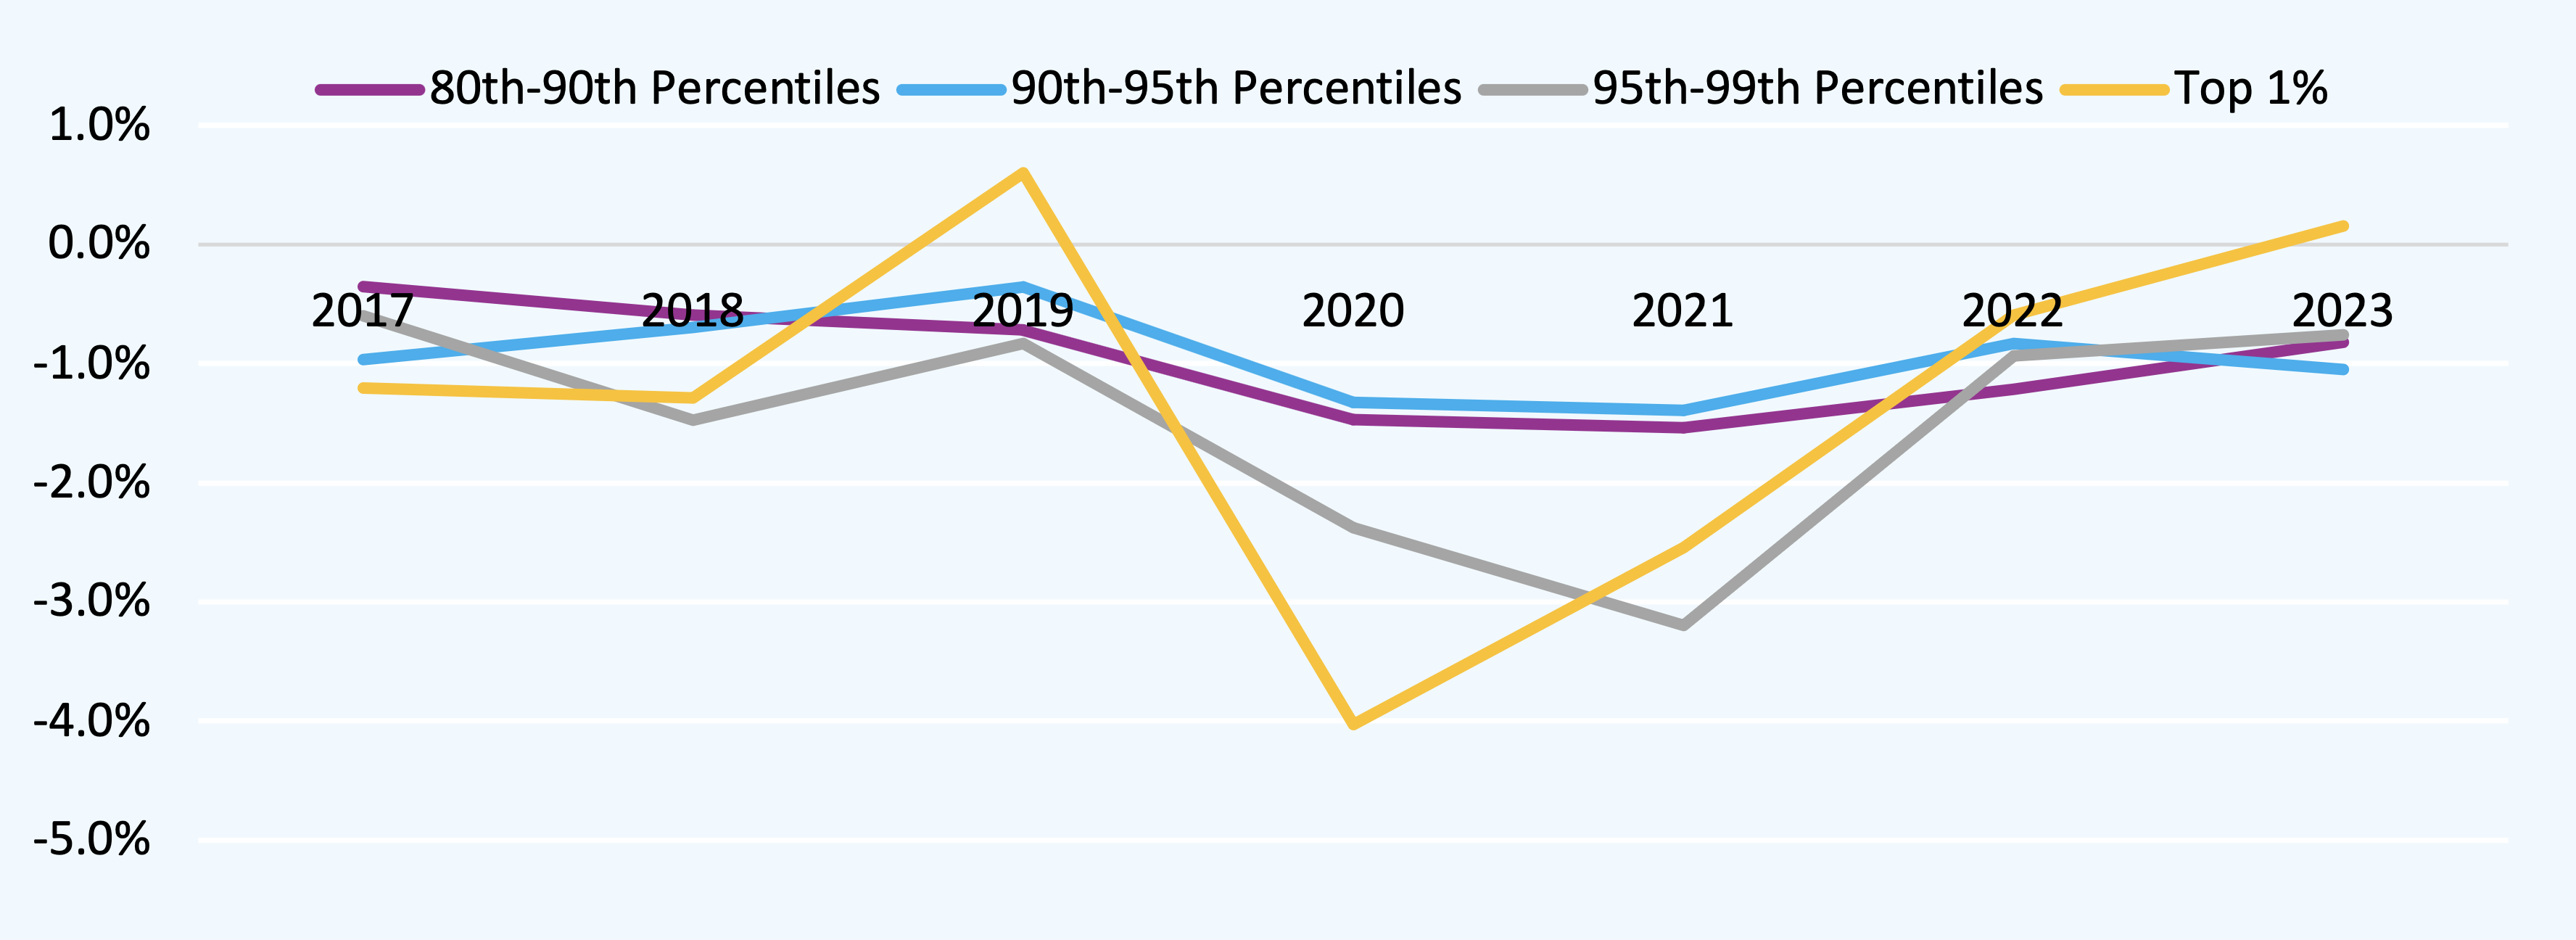
Fig. 1. Net Outmigration Rates from New York, by household income, breakdown of top 20 percent
The “Taxpayer Migration in New York State” dashboard provides important data to the public. The press release → from the Comptroller’s office notes that it is middle class New Yorkers who have been at greatest risk of leaving the state in recent years, rather than very high earners.
Unfortunately, the dashboard does not sufficiently disaggregate the top income bin to make clear what is happening among New York’s top 1%. It combines all households earning more than $500,000 annually into a single group that appears to have the highest rate of outmigration.
In contrast, FPI research ↓ has shown that if incomes are further restricted to the top 1% of households, those taking in around $815,000 per year, top earners are in fact the least likely to move out of New York. The sole exceptions to this trend were the pandemic years of 2020 and 2021, when high income earners were disproportionately likely to have access to both remote work and out-of-state second homes. Because the top income bin on the dashboard combines the top 1% and those making between $500,000 and $815,000 annually in household income, the bar charts misleadingly imply that New Yorkers are consistently more likely to outmigrate as their incomes increase. As a result, the Comptroller’s tax migration dashboard masks the sharp turnaround in outmigration rate as incomes reach the top 1%.
Still, the dashboard provides important counterevidence to the argument that outmigration among high earners is caused by high marginal tax rates. While it shows that those in wealthier income bins outmigrate at higher rates than others, it also demonstrates that outmigration rates have been decreasing across the board since the pandemic, including among those earning more than $500,000 per year. Importantly, this includes 2021, when the state increased taxes on millionaire income earners. FPI research further verifies this point, noting that New York saw no significant increase in millionaire outmigration in the wake of state income tax increases.
What’s more, FPI analysis ↓ of the state’s tax data demonstrates that tax increases on the top 1% show clear revenue gains. A broad swathe of economists and policy experts, representing institutions as diverse as the Roosevelt Institute and the International Monetary Fund, recognize → that tax migration is nowhere near extensive enough to undercut the revenue gains from increased tax rates.
Fig. 2. Part-year residents as a percent of all filers, by annual income and tax year
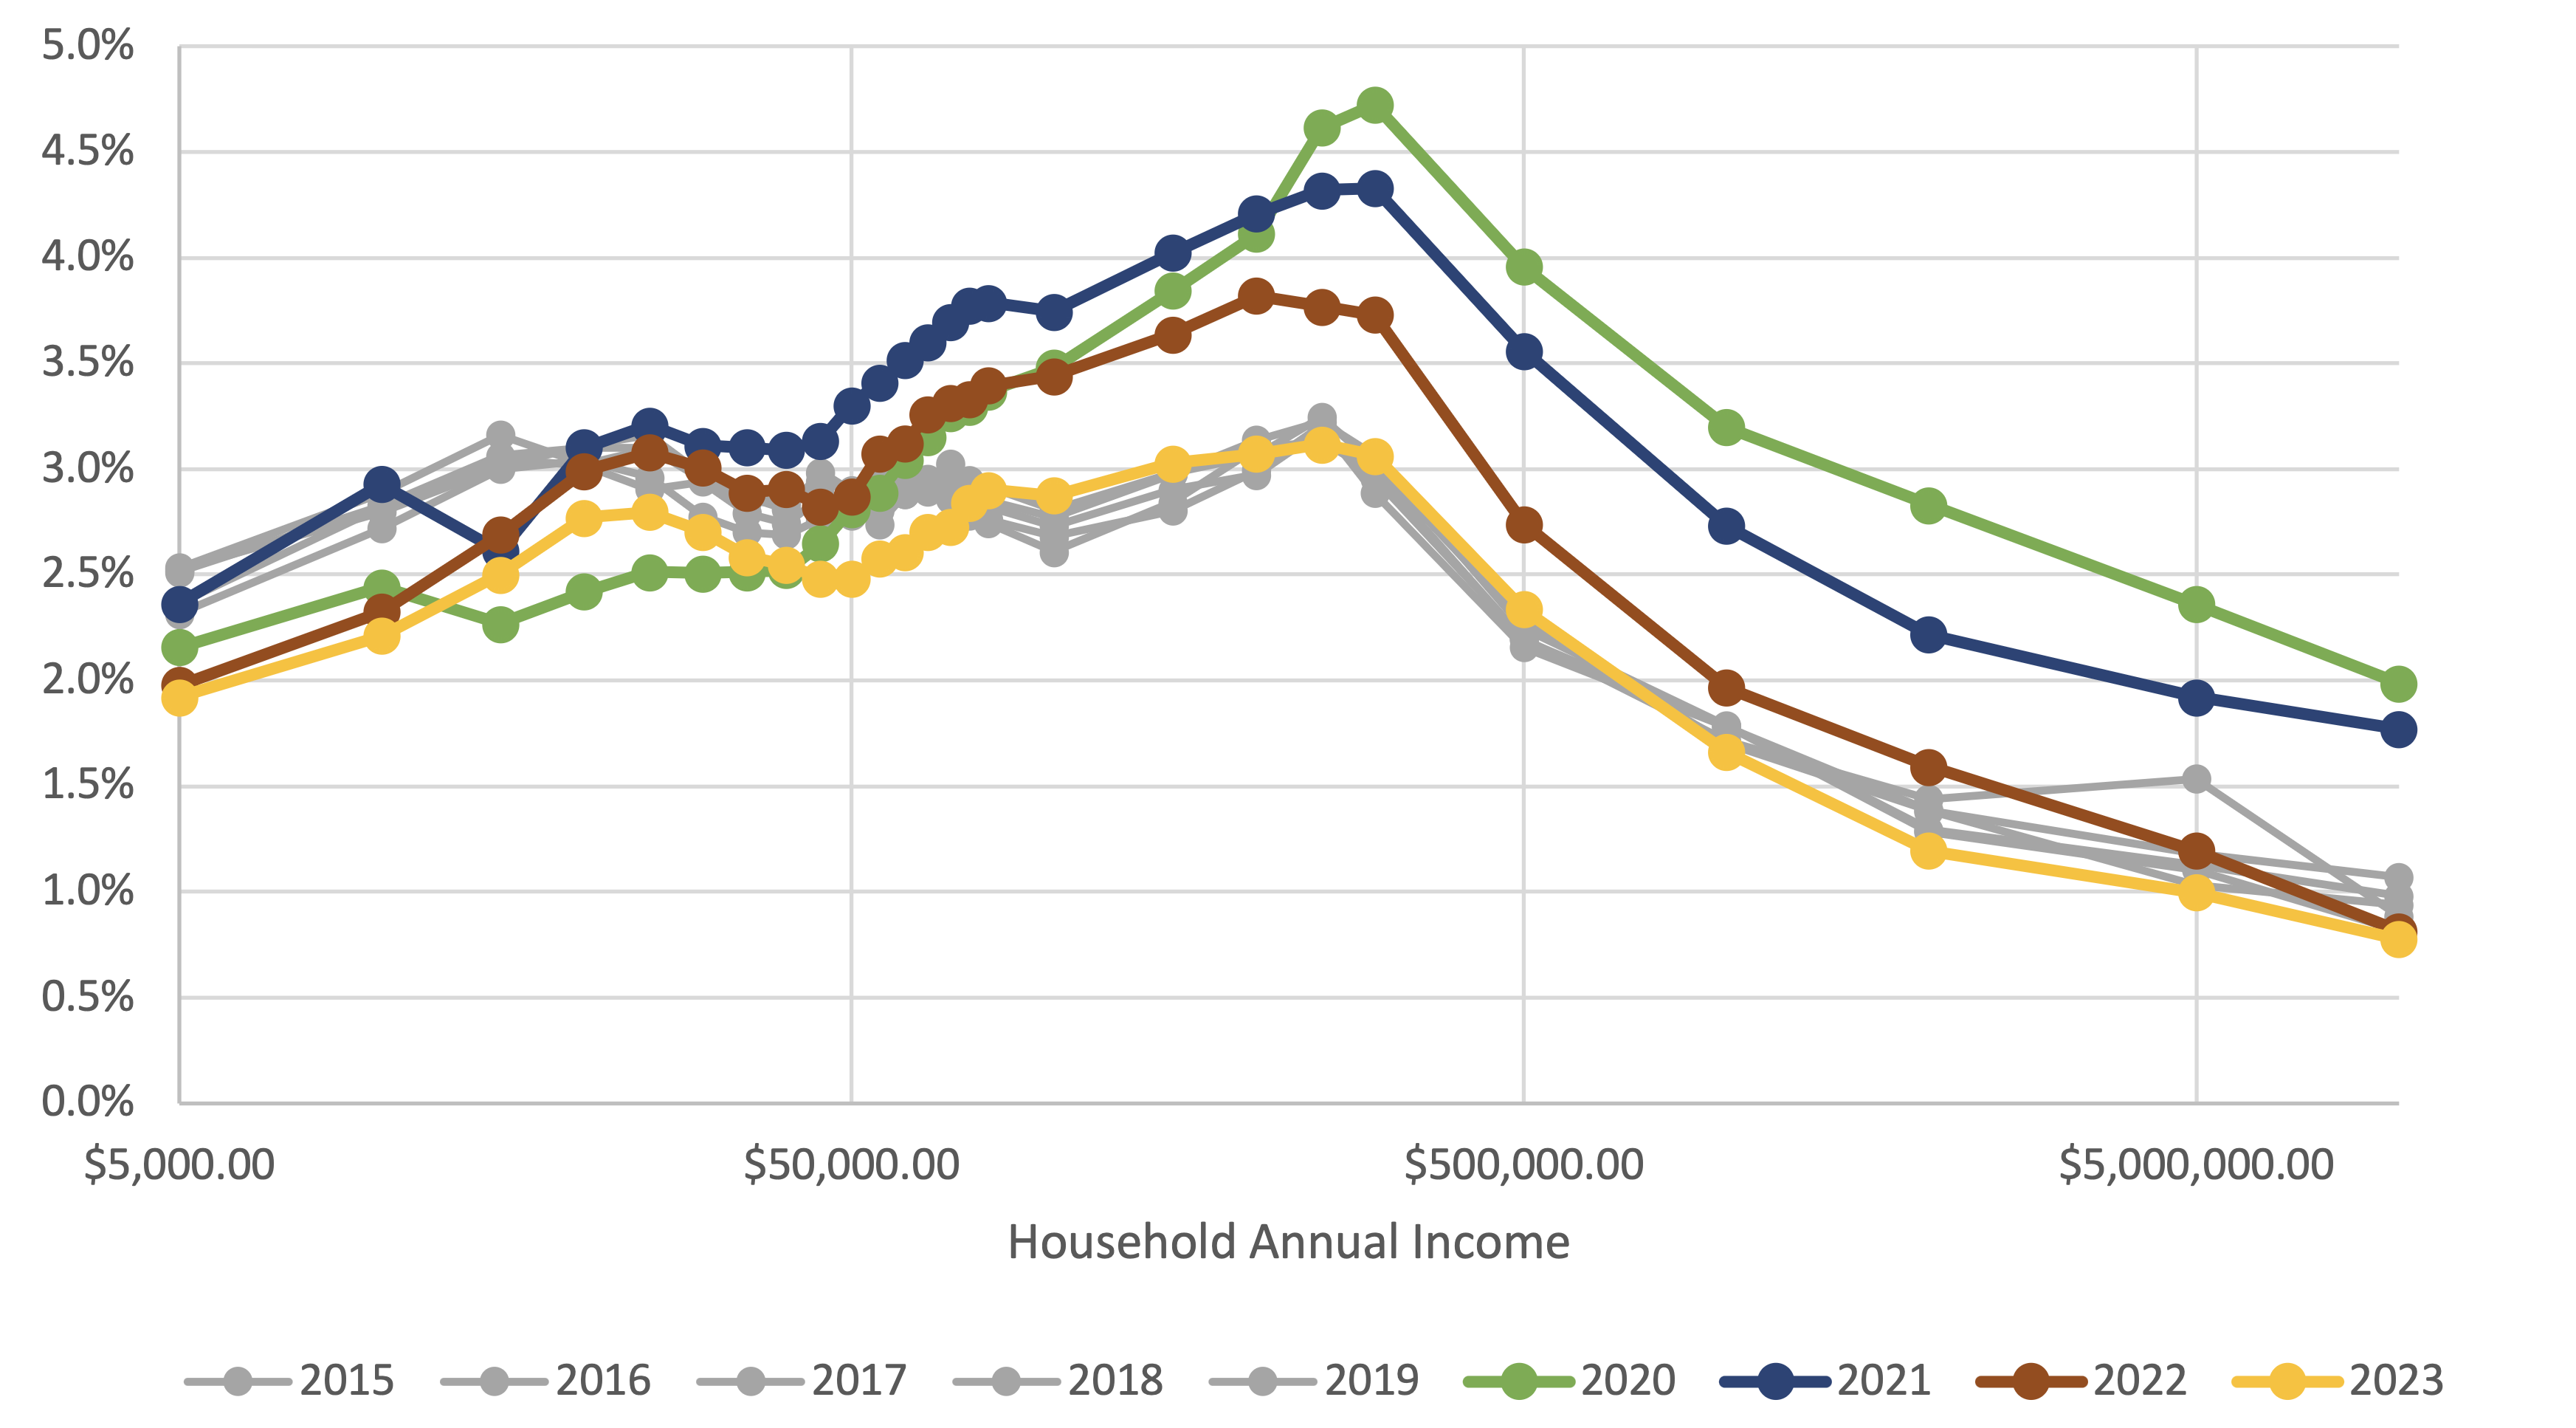
Overall, the migration dashboard is a useful resource for the public on New York state’s overall tax base. It provides some relevant indication that tax rates are not in and of themselves a major drive of outmigration from New York. A more detailed presentation of high earner income brackets would clarify what misleadingly appears to be an outmigration rate that steadily increases with earner income, when in fact we know that outmigration rates are lowest for the top 1% of households.