All the figures listed below are in JPEG format. The briefing book page number on which each figure appears is included below.
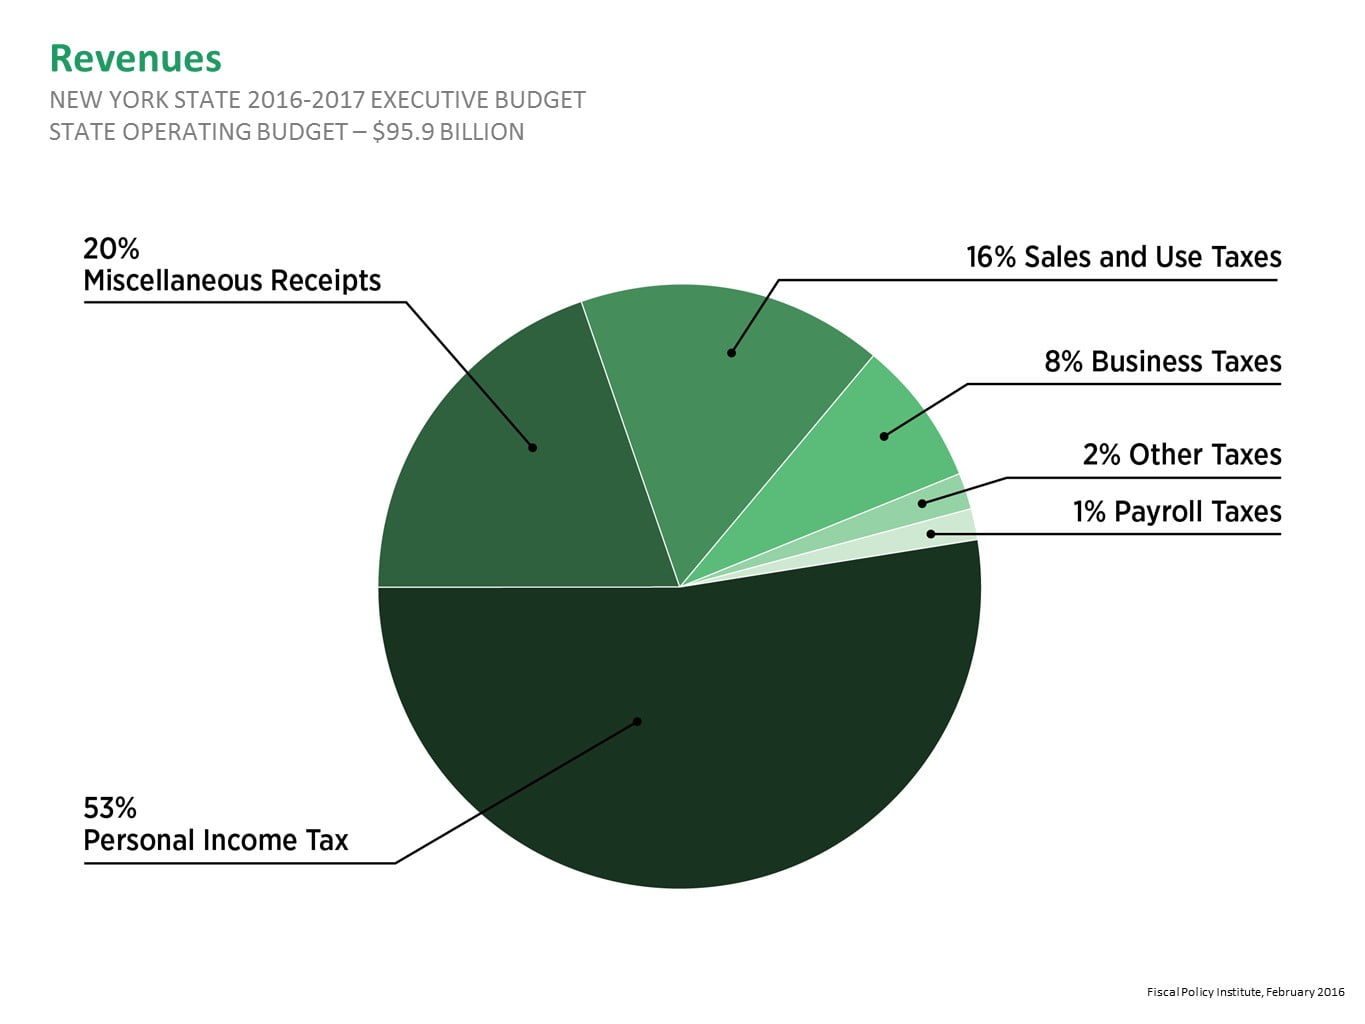
NYS FY 2017 Expenditures – Page 5
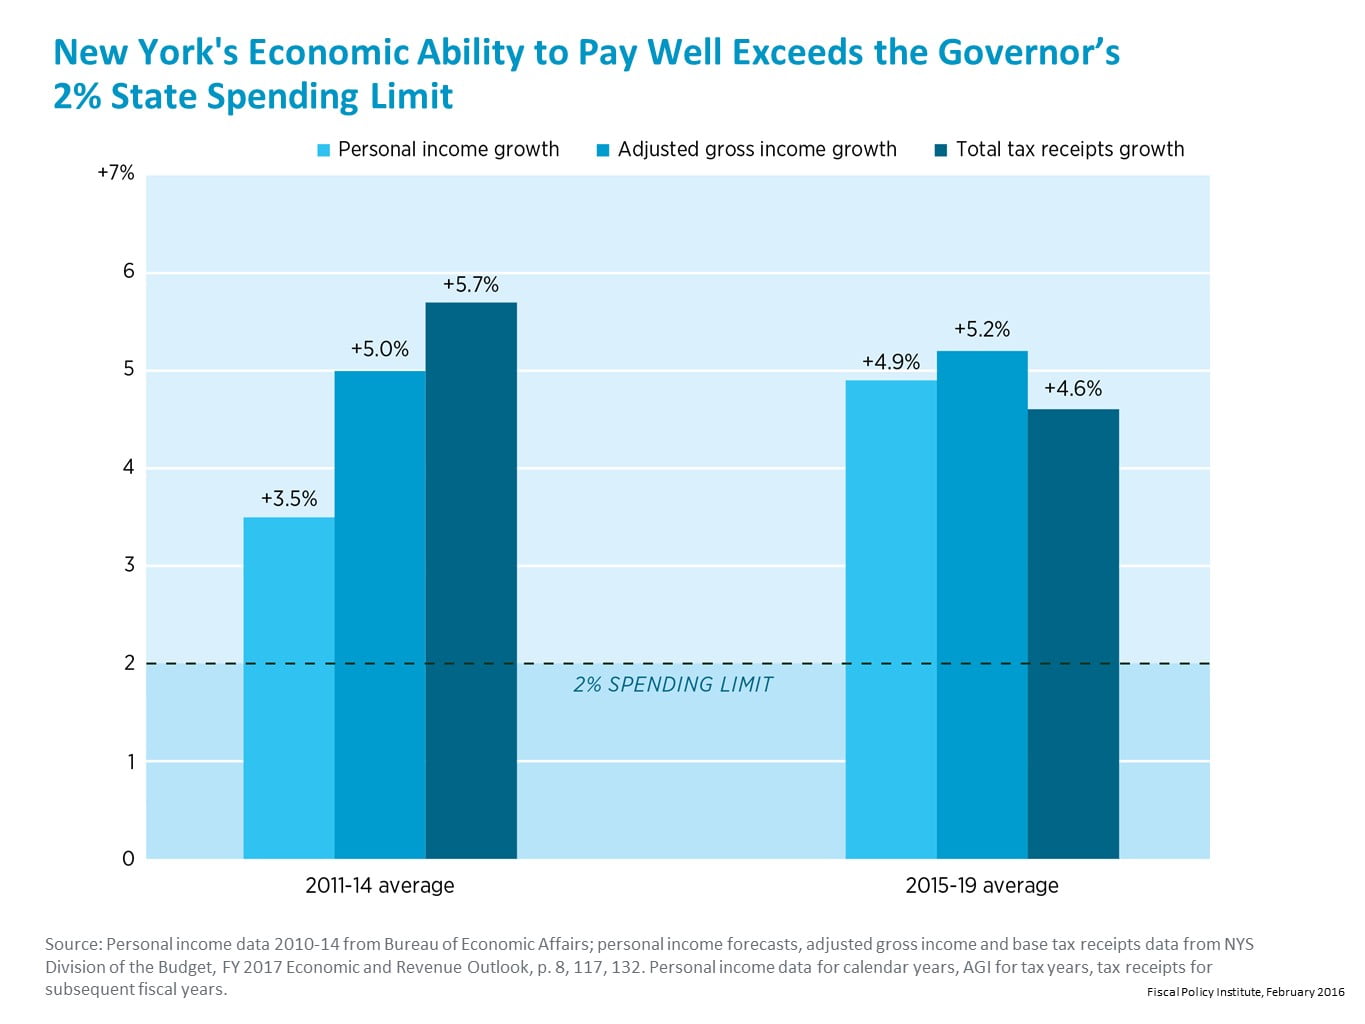
Fig 2. NY’s Economic Ability to Pay Well Exceeds the Governor’s 2% State Spending Limit – Page 11
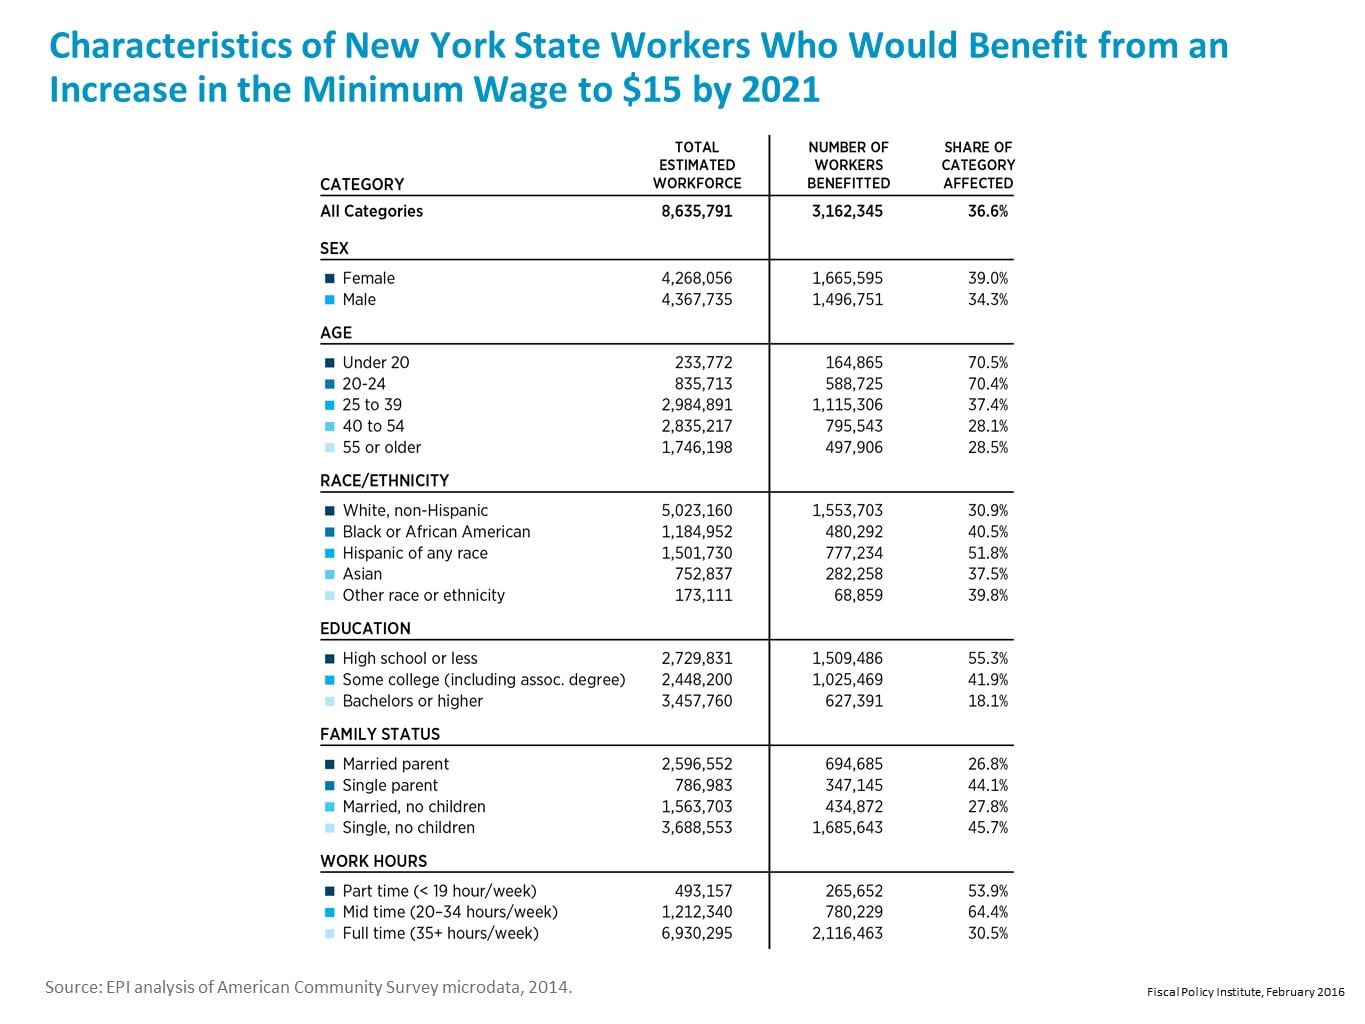
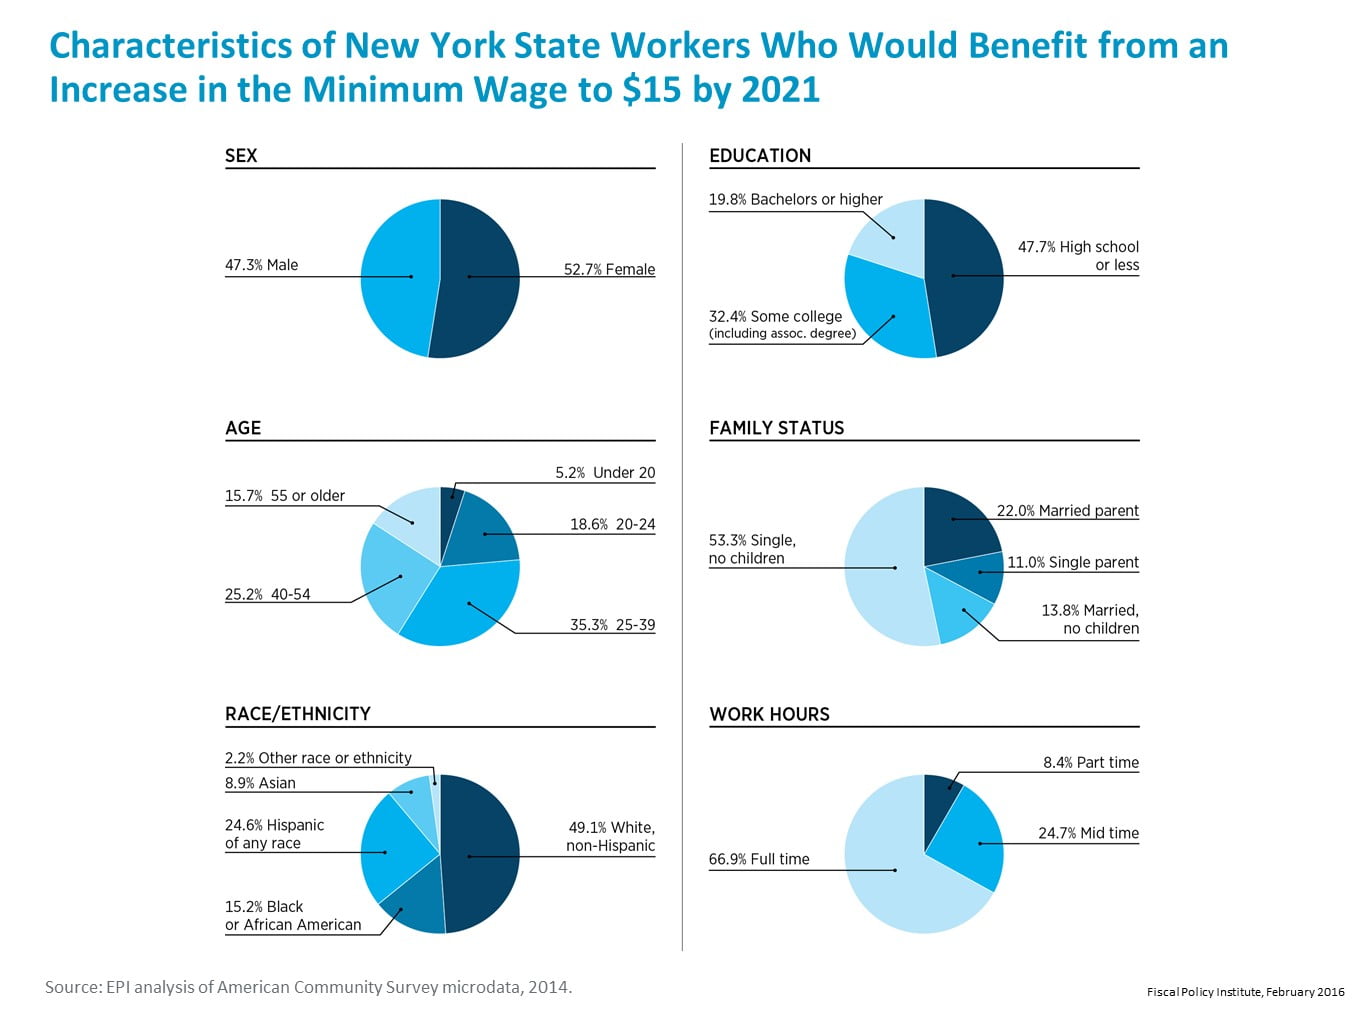
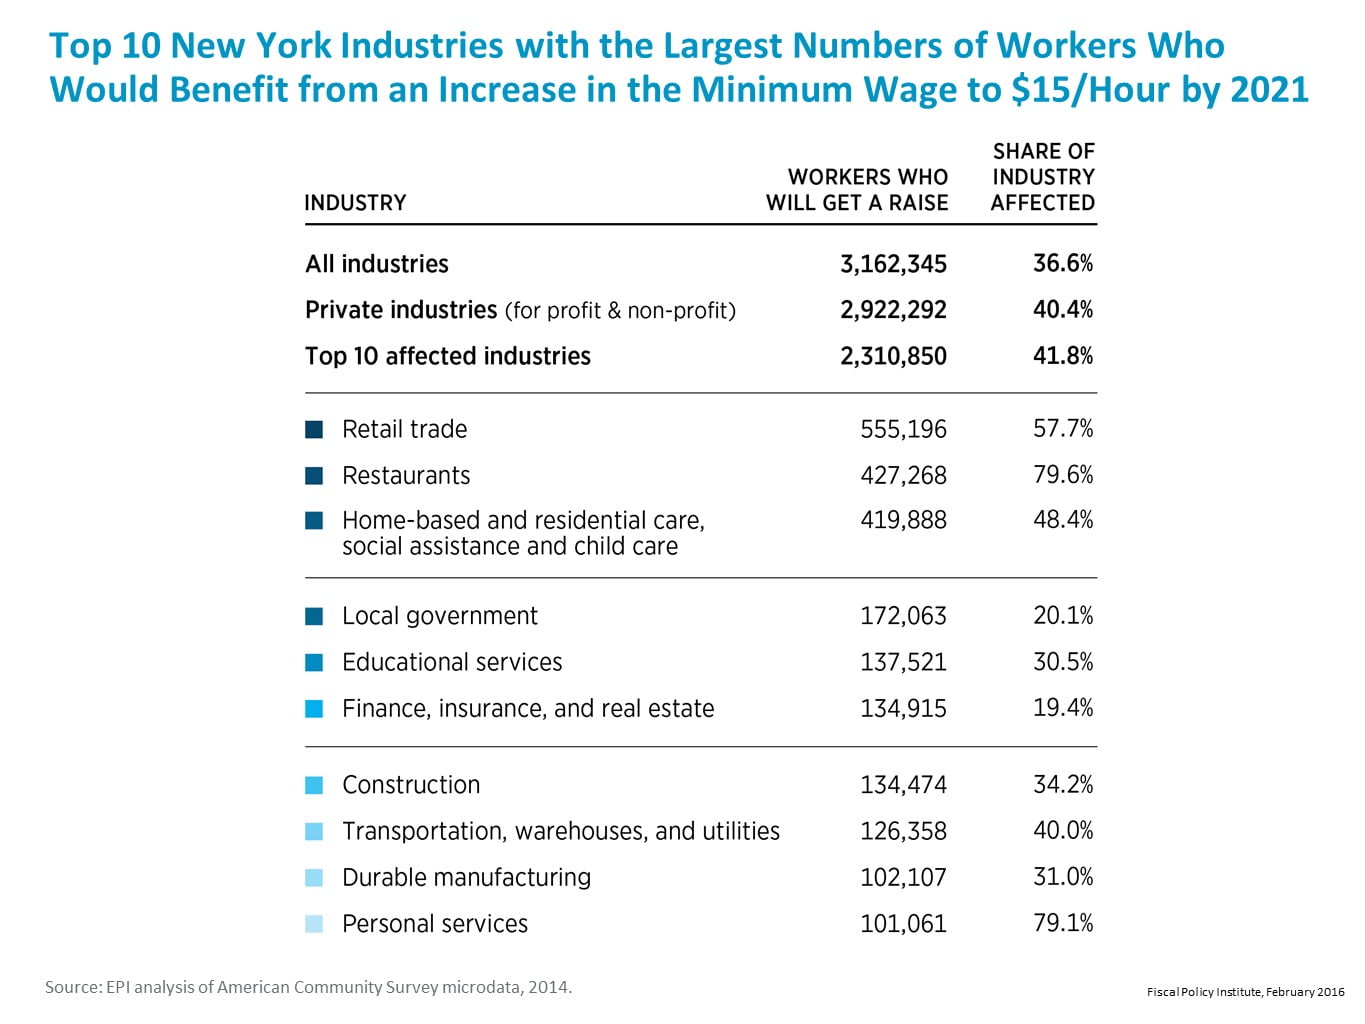
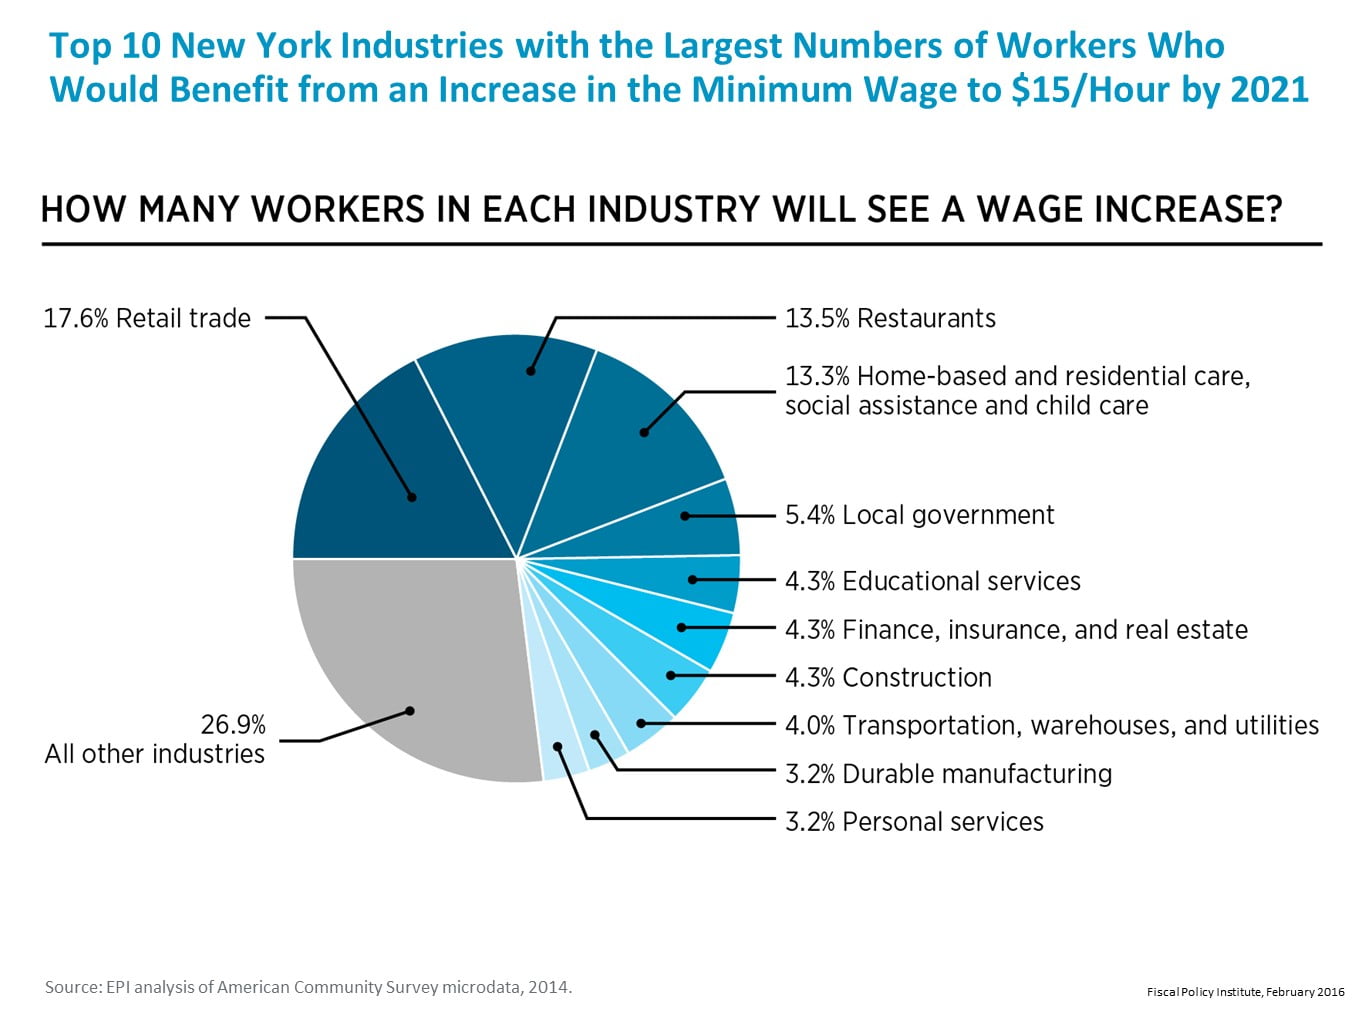
Fig 4b. How Many Workers in Each Industry Will See a Wage Increase – Page 16
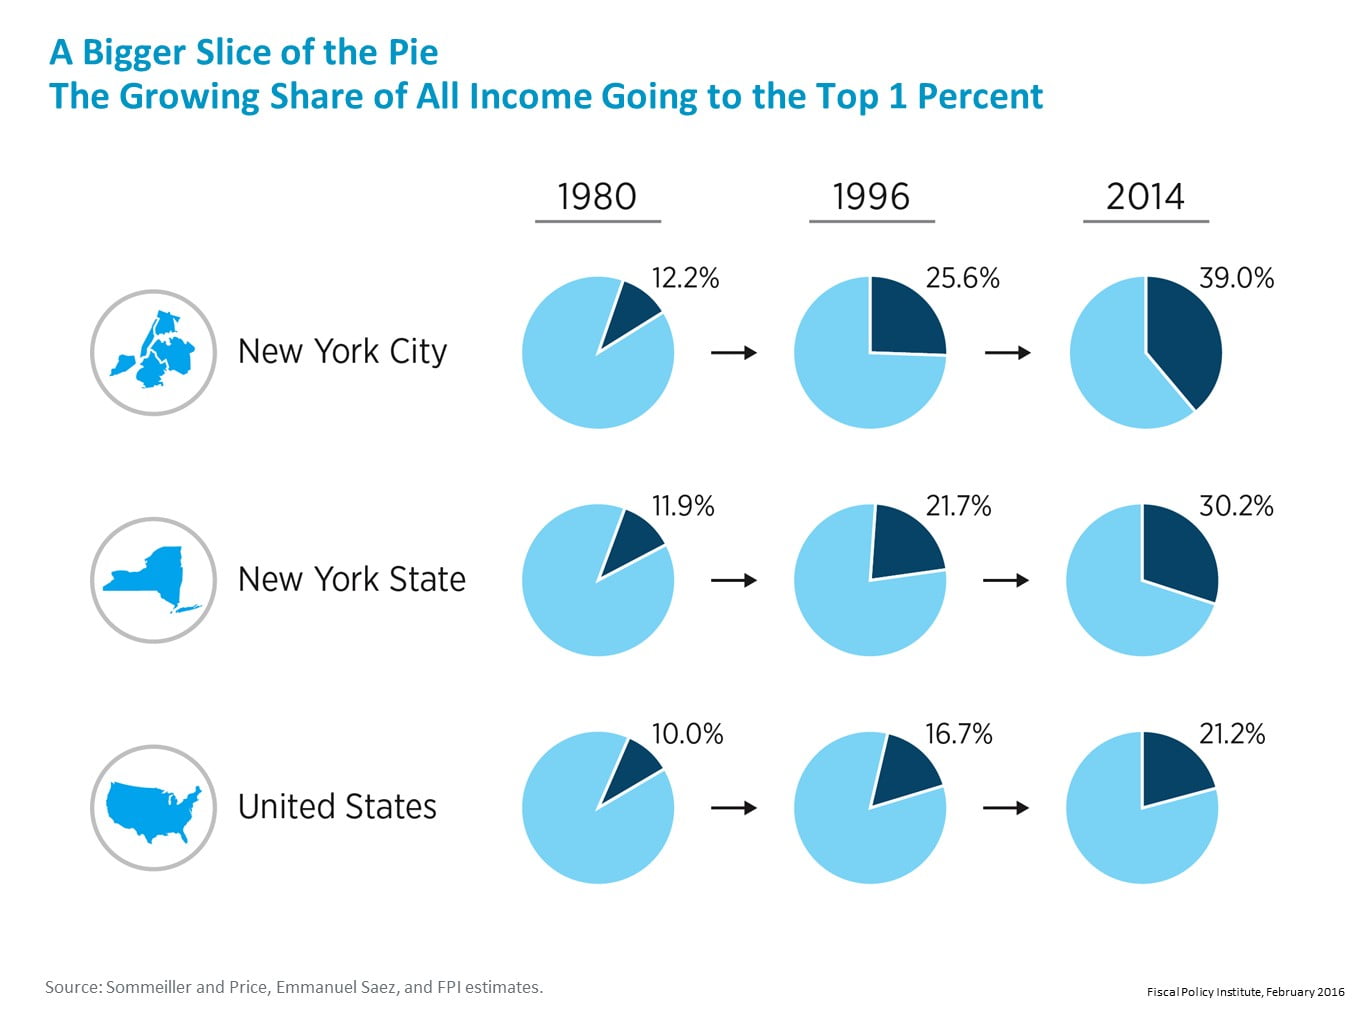
Fig 5. The Growing Share of All Income Going to the Top 1 Percent – Page 20
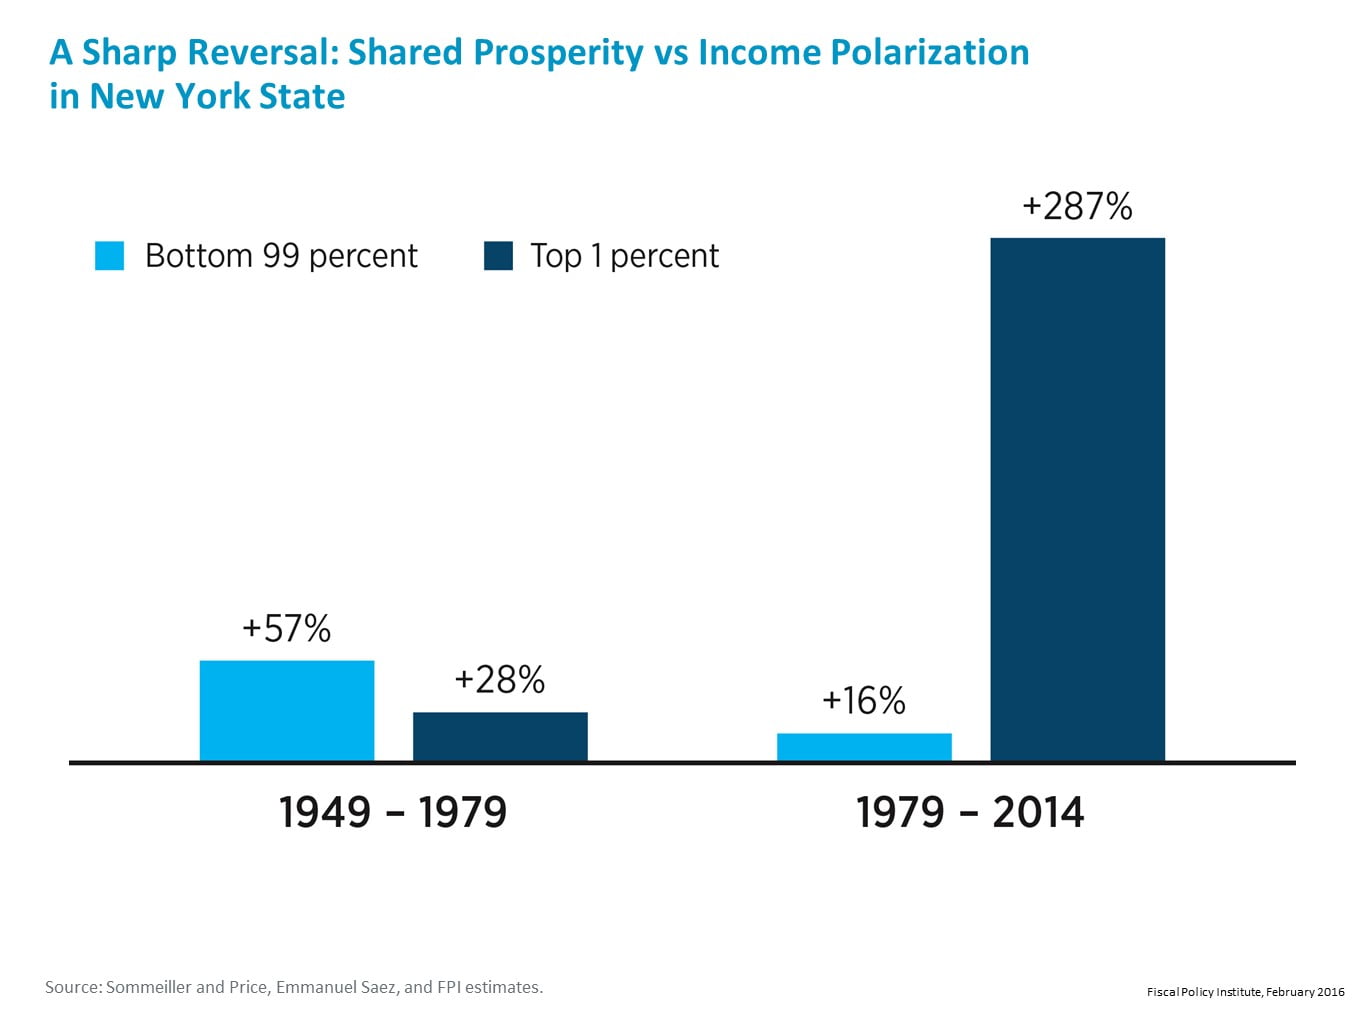
Fig 6. A Sharp Reversal: Shared Prosperity vs Income Polarization in NYS – Page 21
Fig 7. NYS’s Regressive State and Local Tax System – Page 22
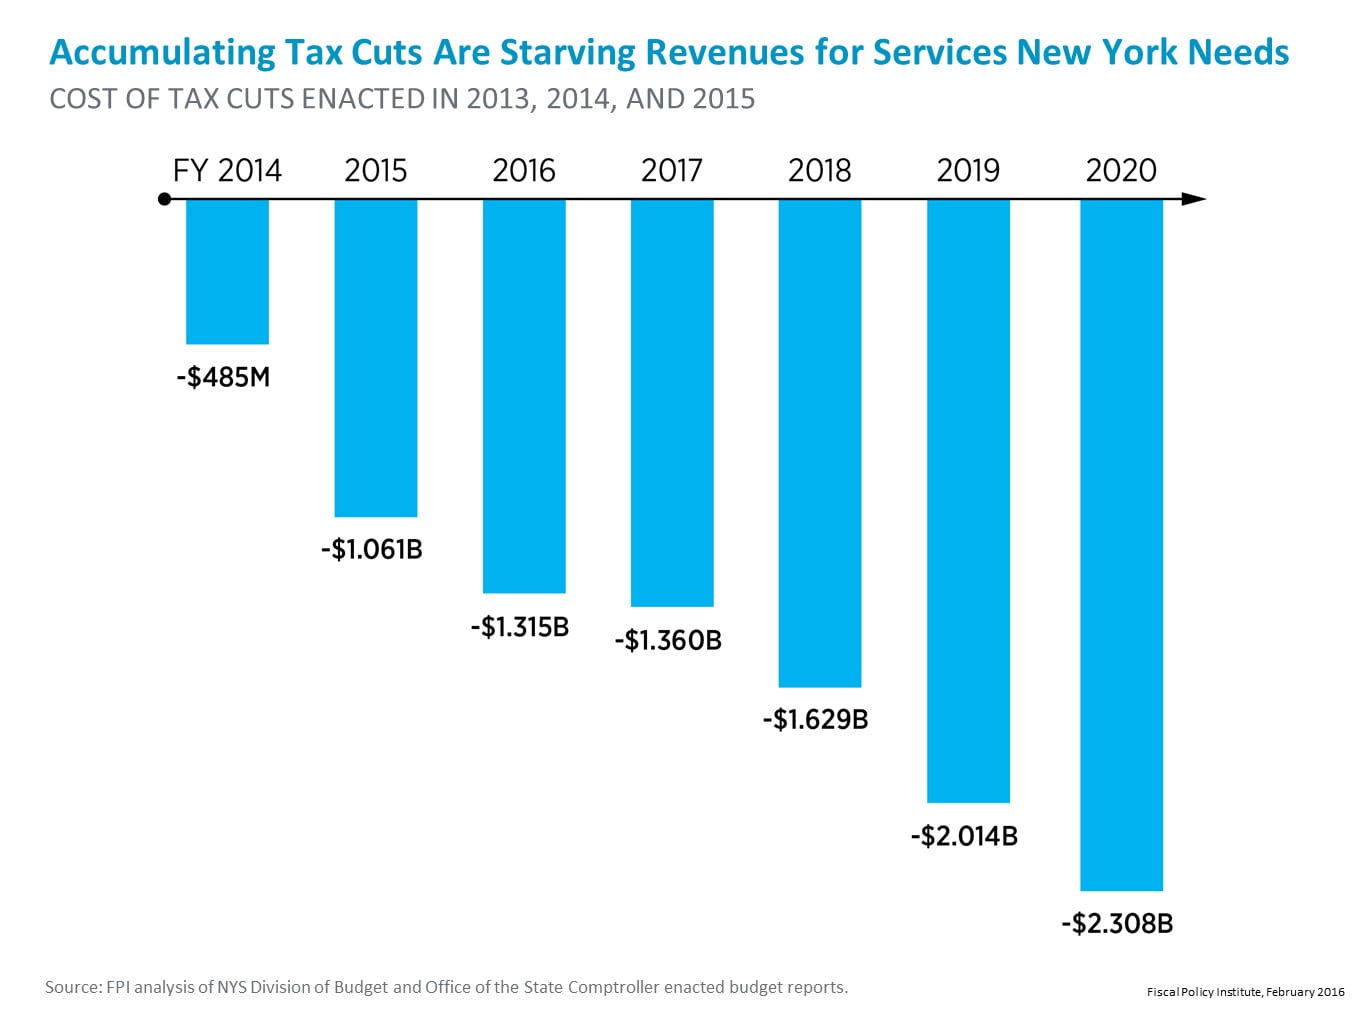
Fig 8. Accumulating Tax Cuts Are Starving Revenues for Services NY Needs – Page 23
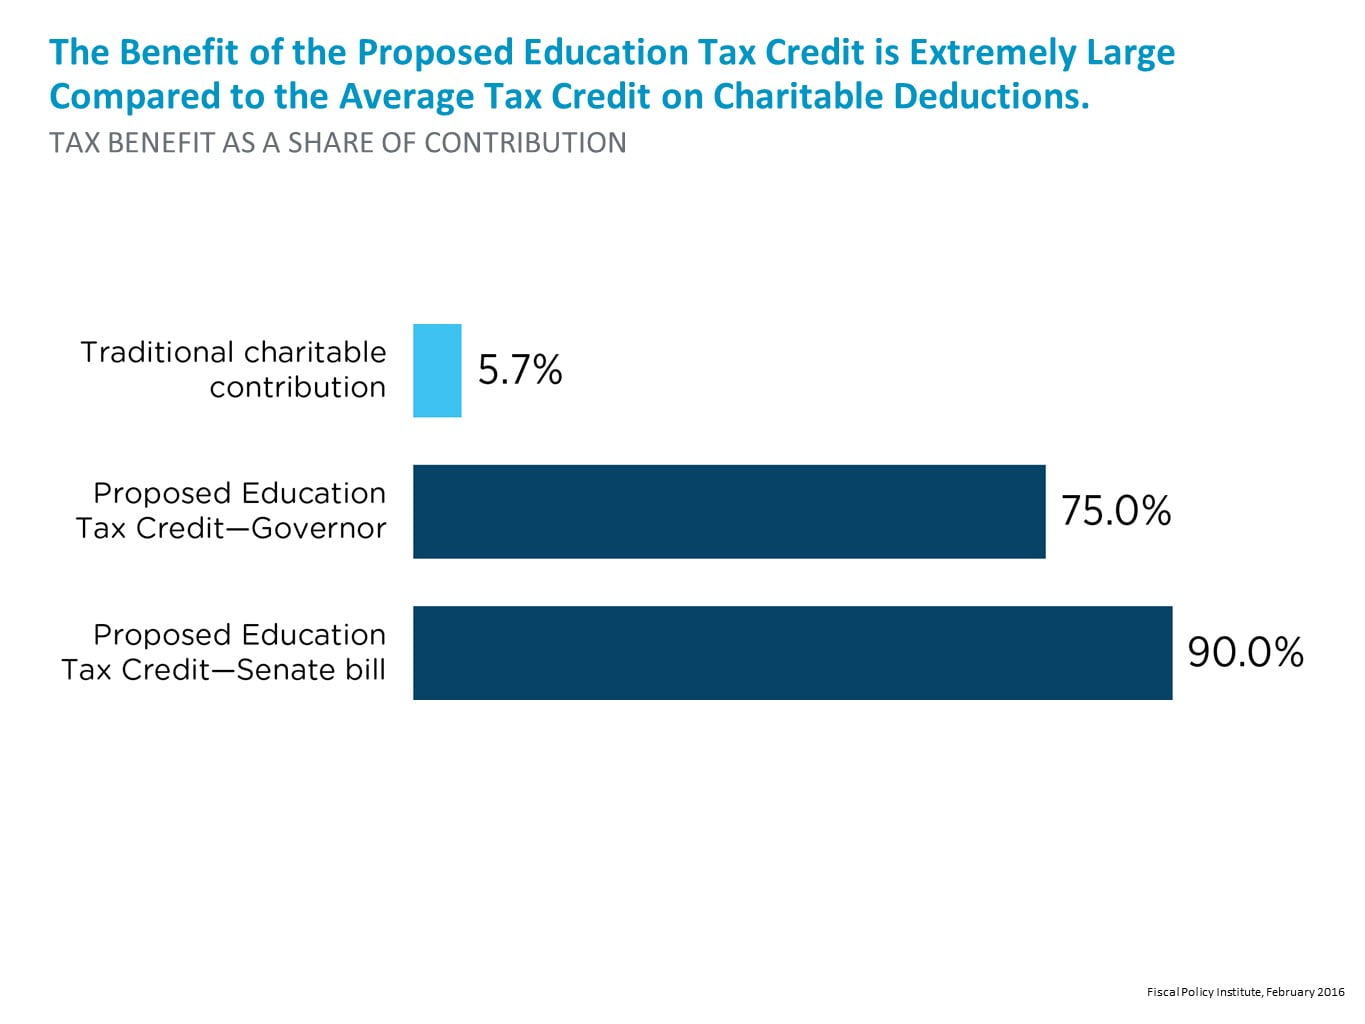
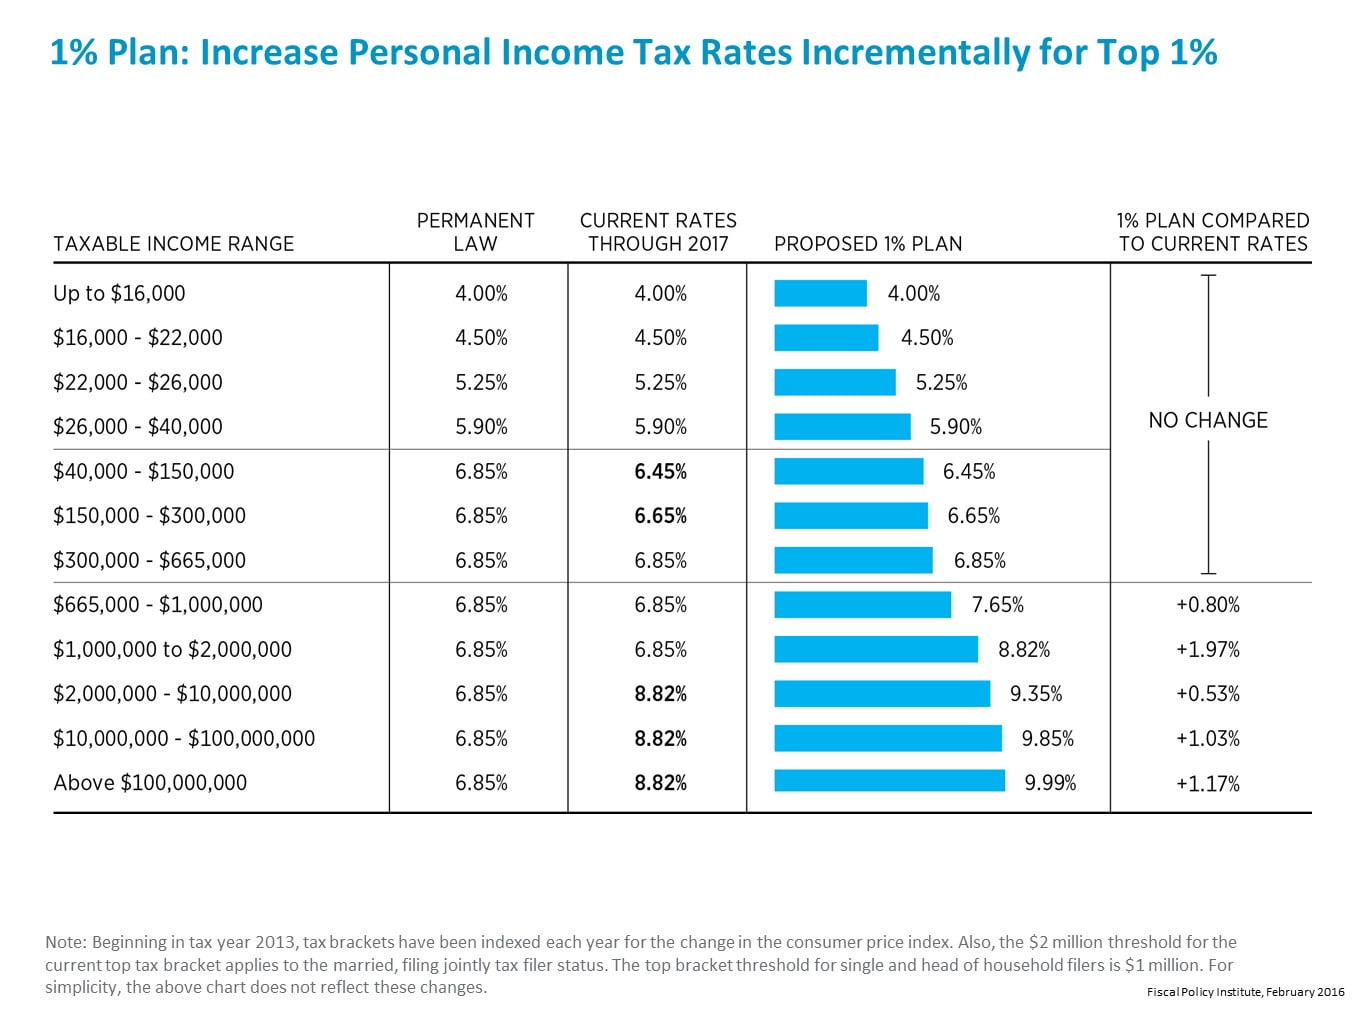
Fig 10. 1% Plan: Increase Personal Income Tax Rates Incrementally for Top 1% – Page 27
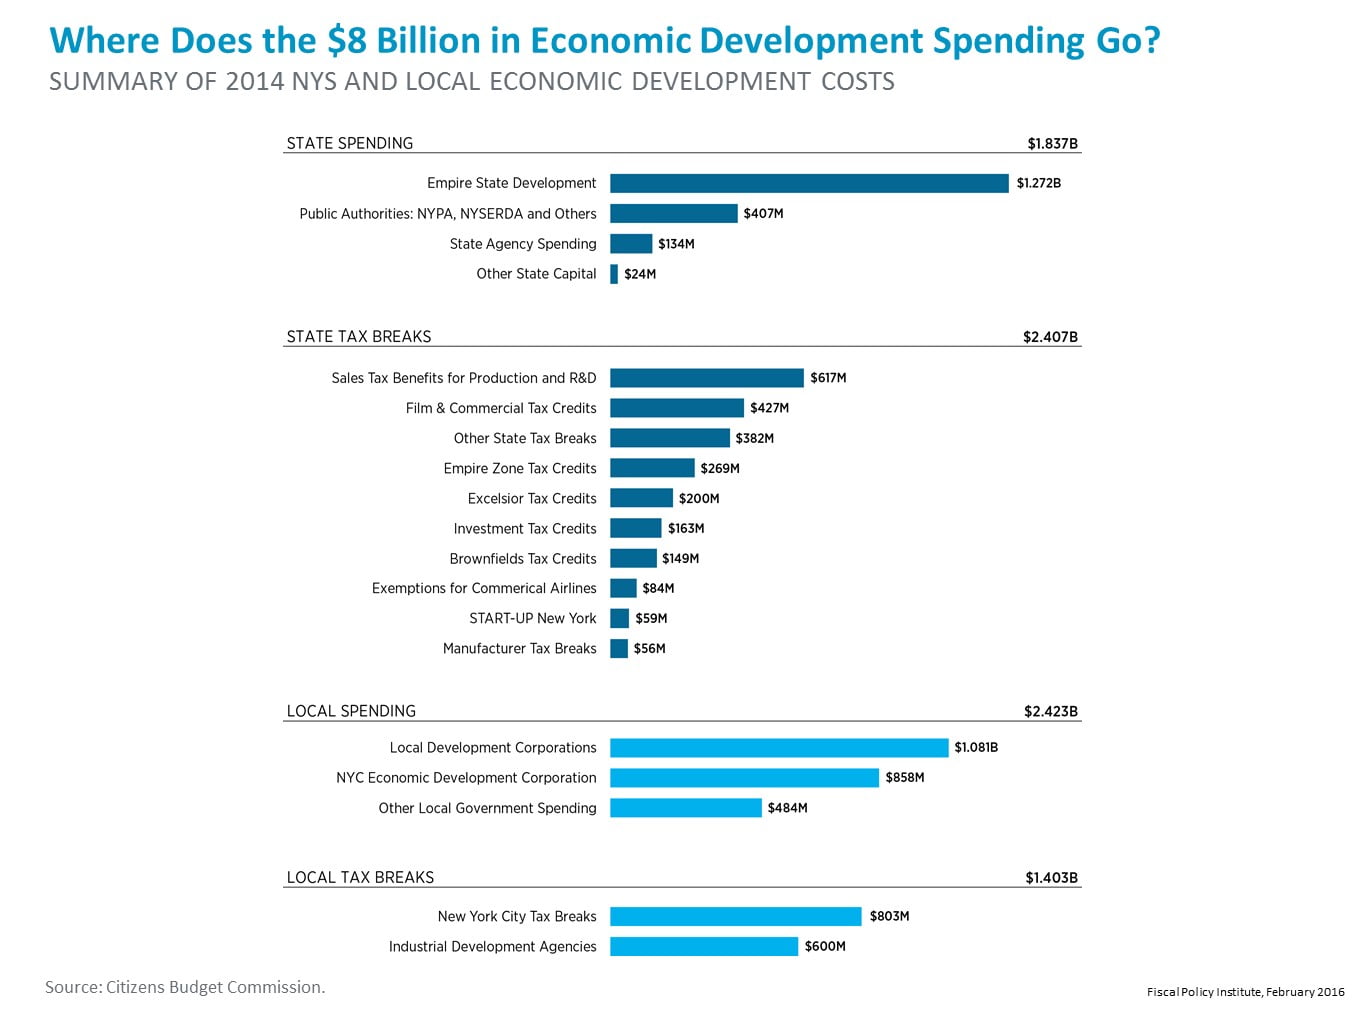
Fig 11. Where Does Our $8 Billion in Economic Development Spending Go? – Page 29
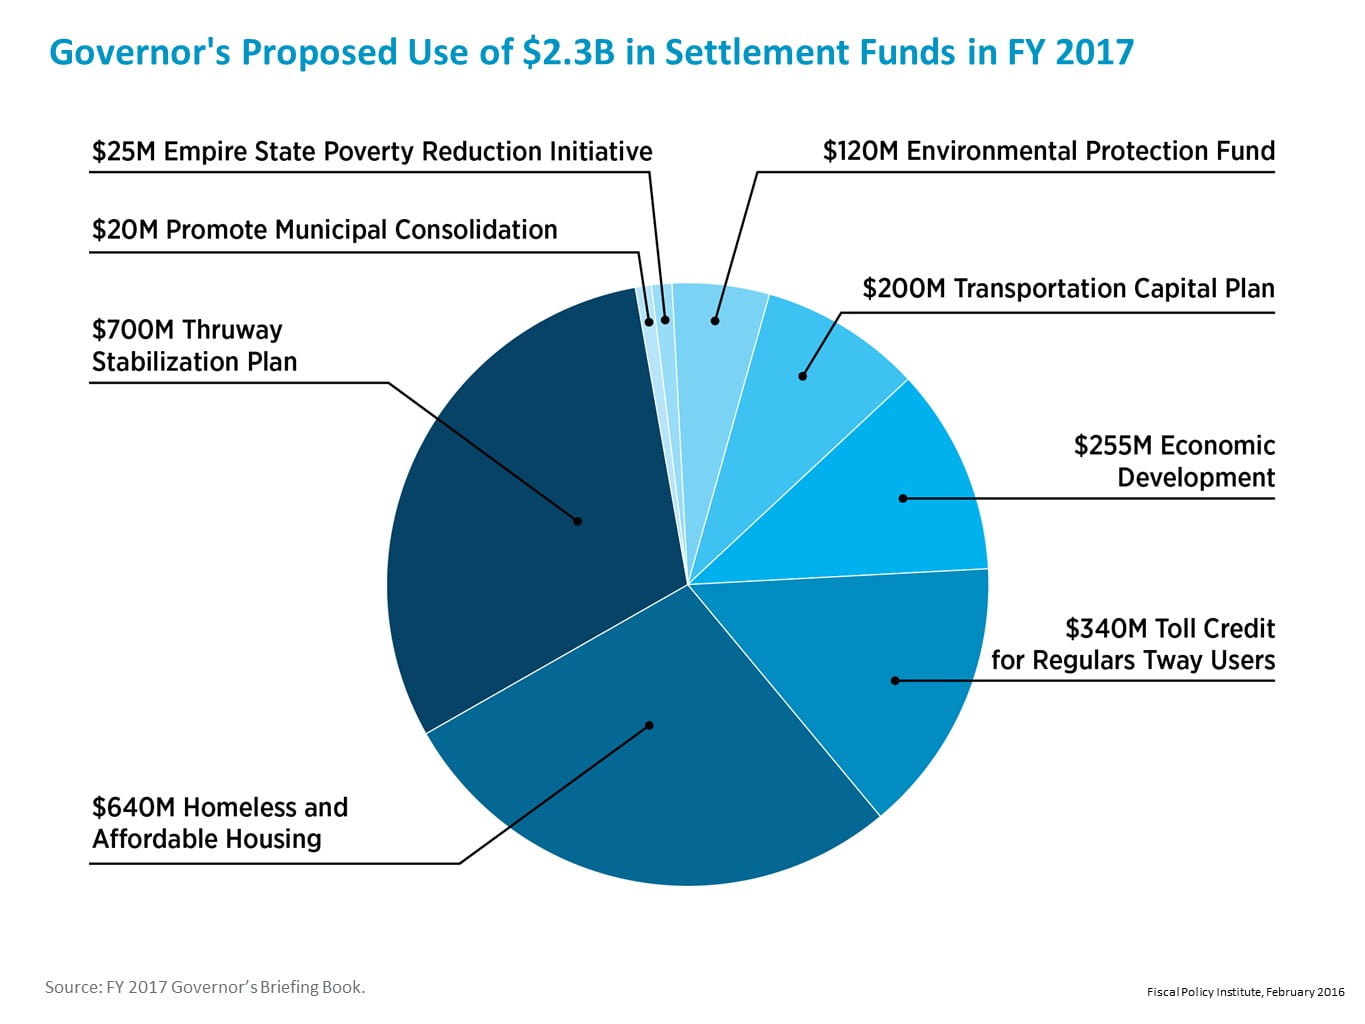
Fig 12. Governor’s Proposed Use of $2.3 Billion in Settlement Funds in FY 2017 – Page 32
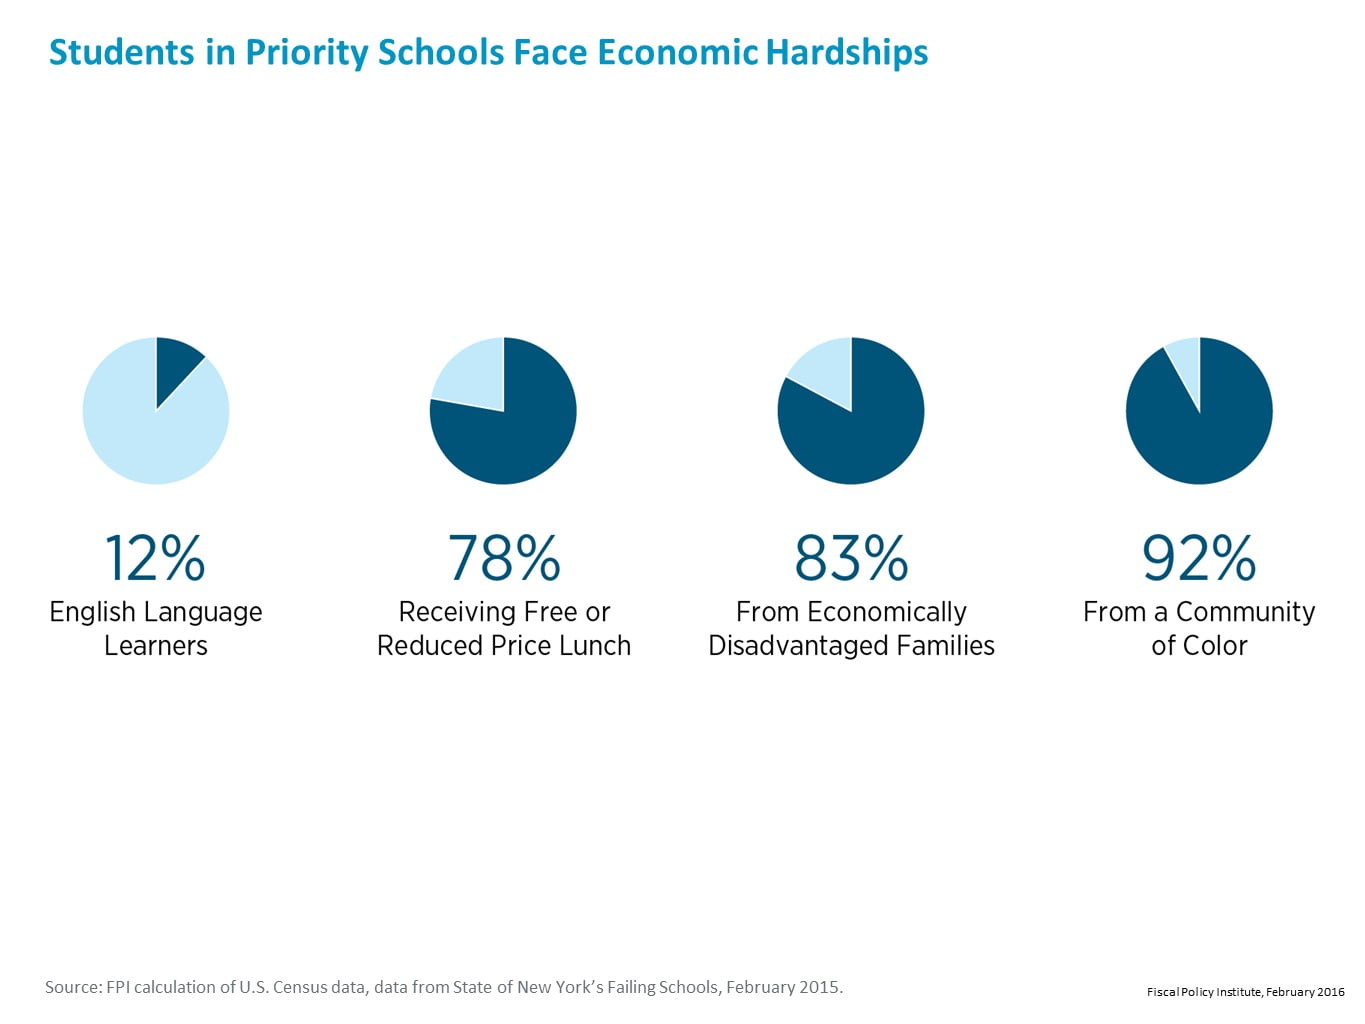
Fig 13. Students in Priority Schools Face Economic Hardships – Page 33
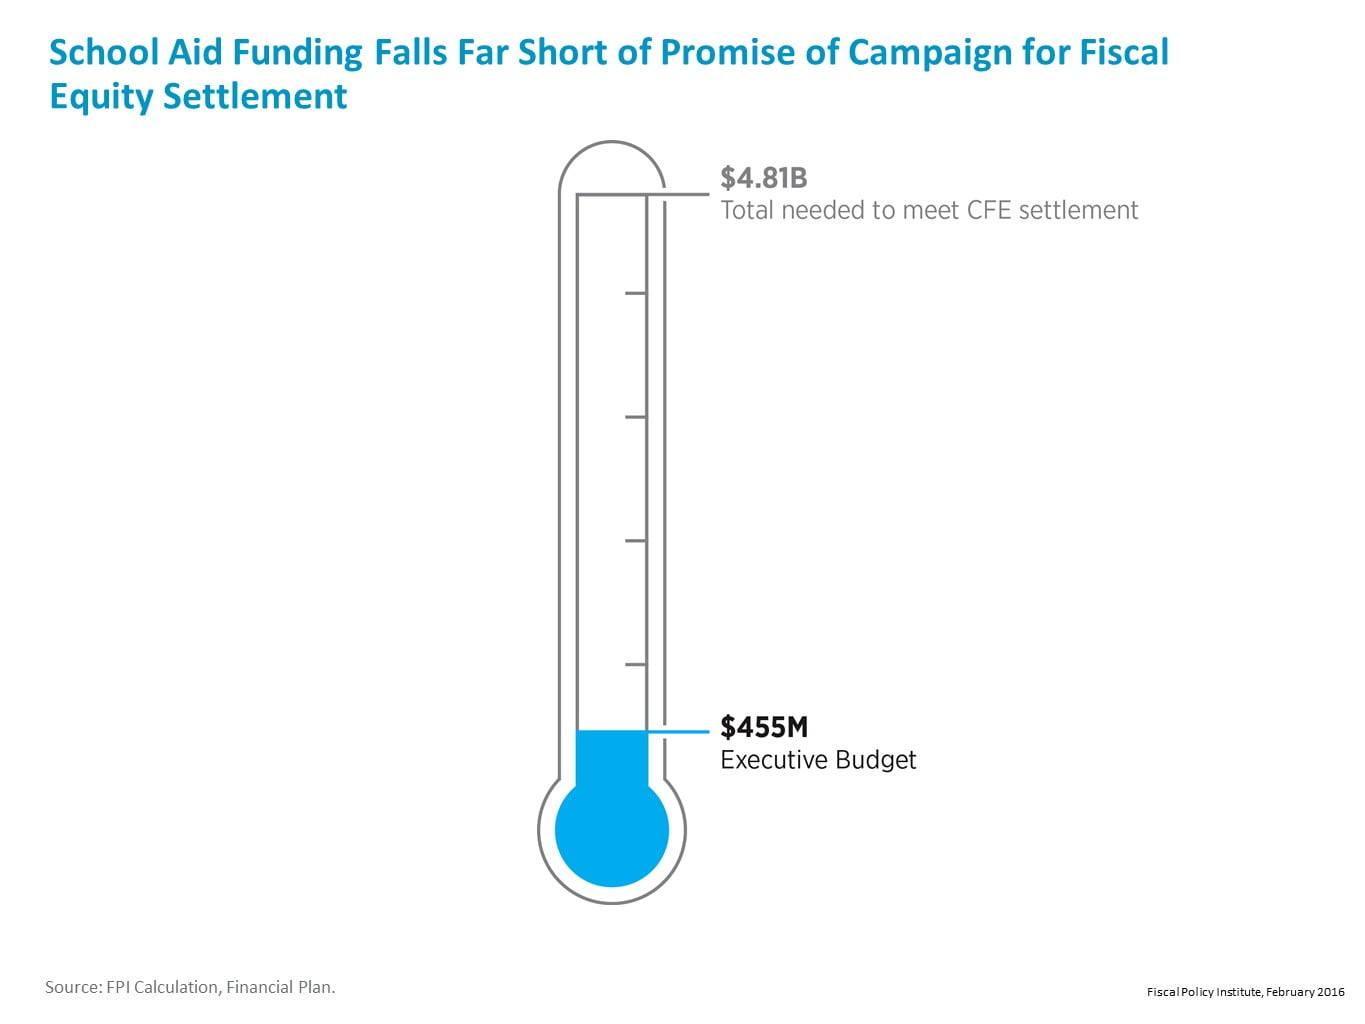
Fig 15. School Aid Funding Falls Short of Promise of CFE Settlement – Page 35
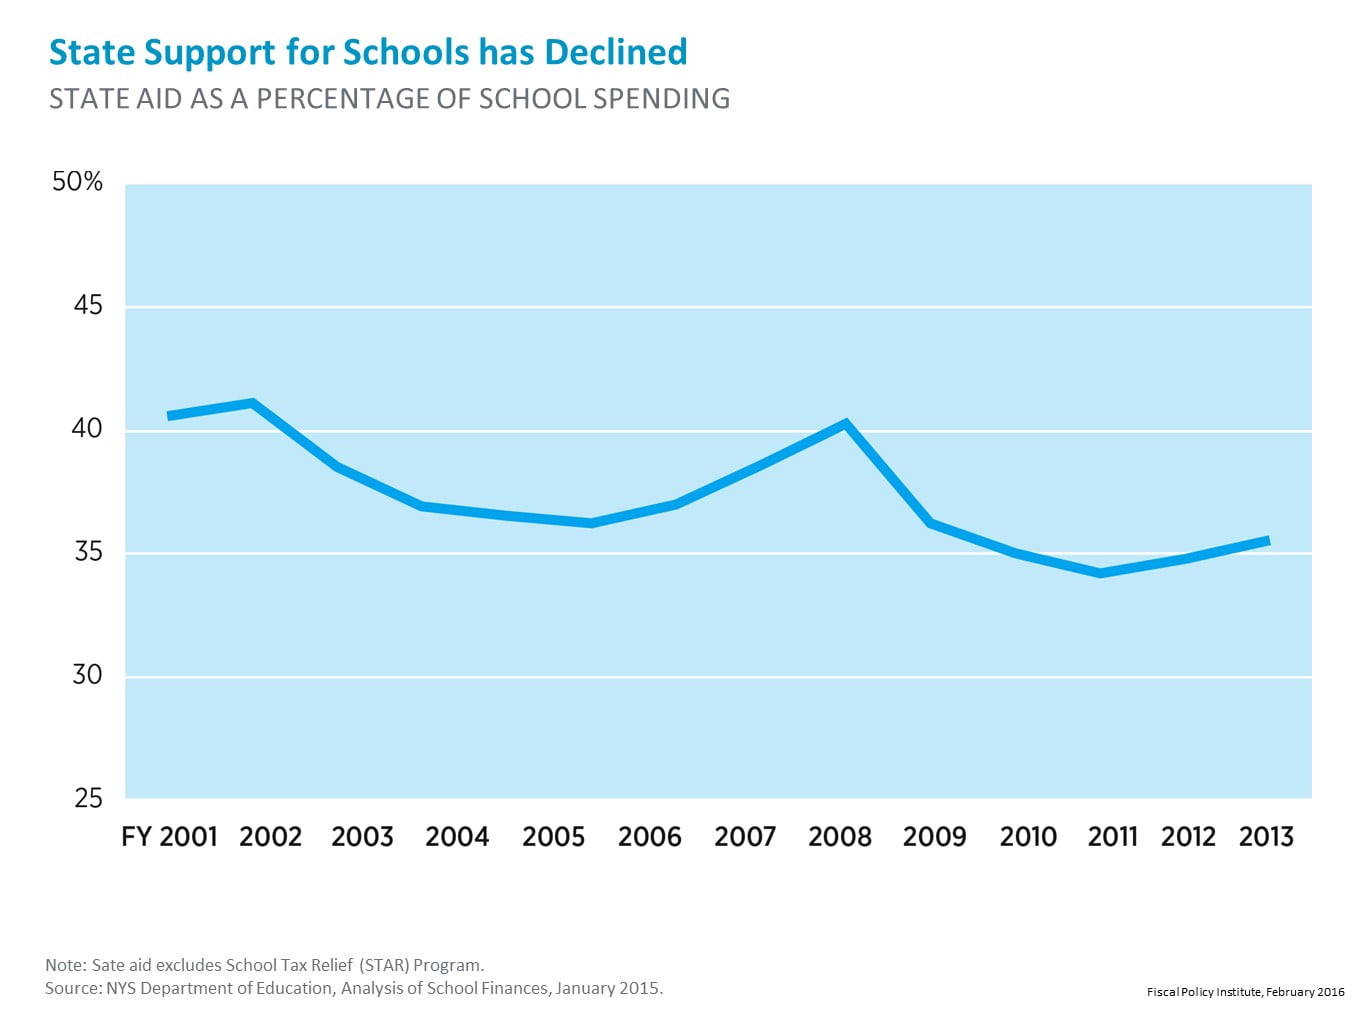
Fig 16. State Support for Schools has Declined – Page 36
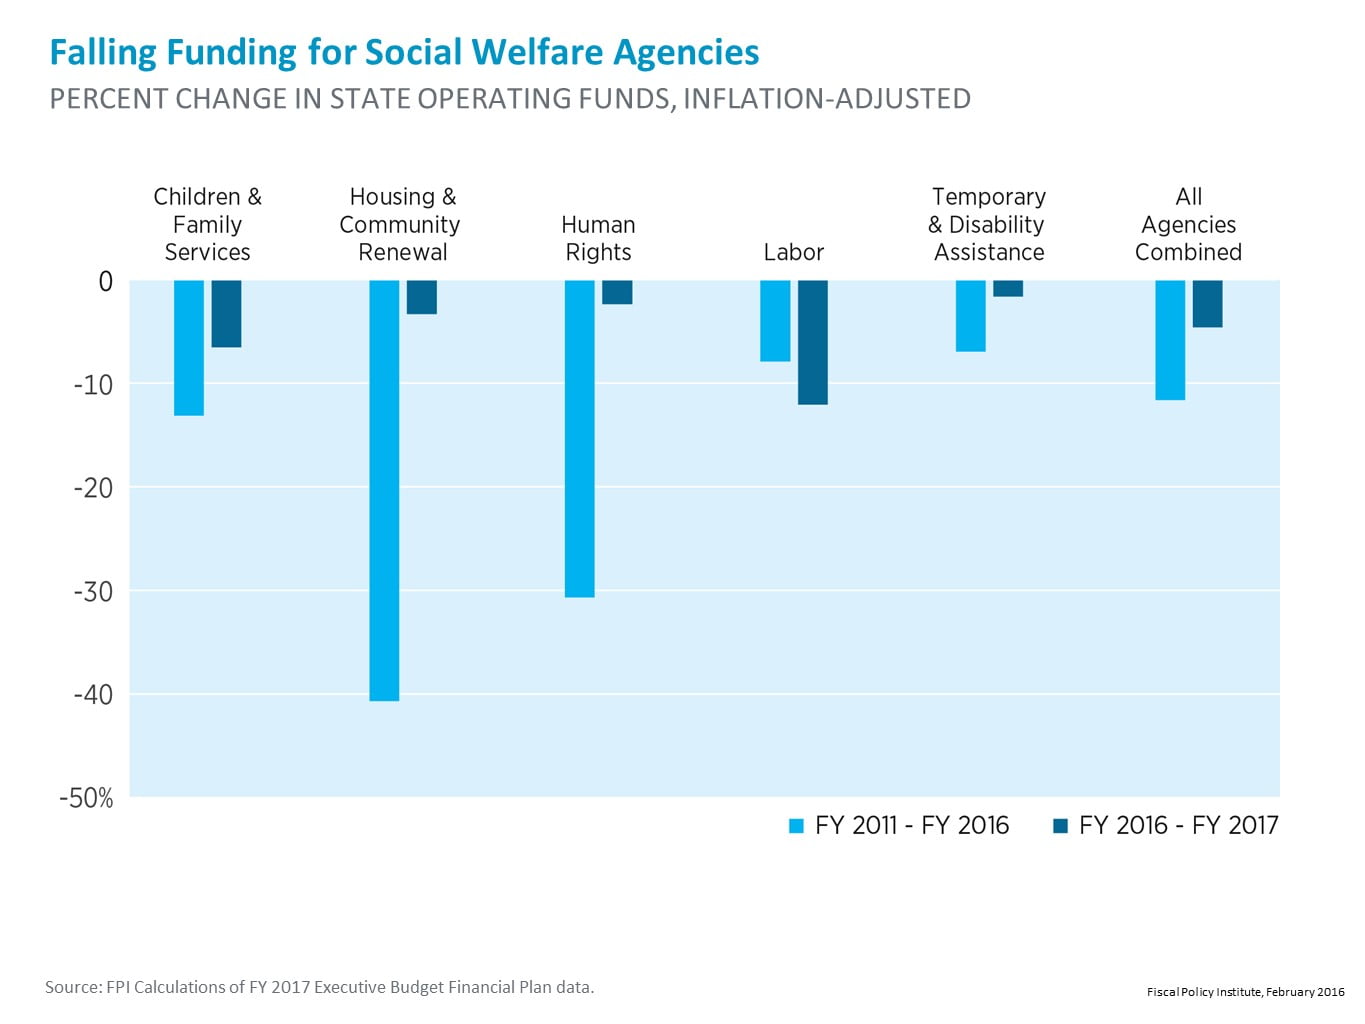
Fig 17. Falling Funding for Social Welfare Agencies – Page 40
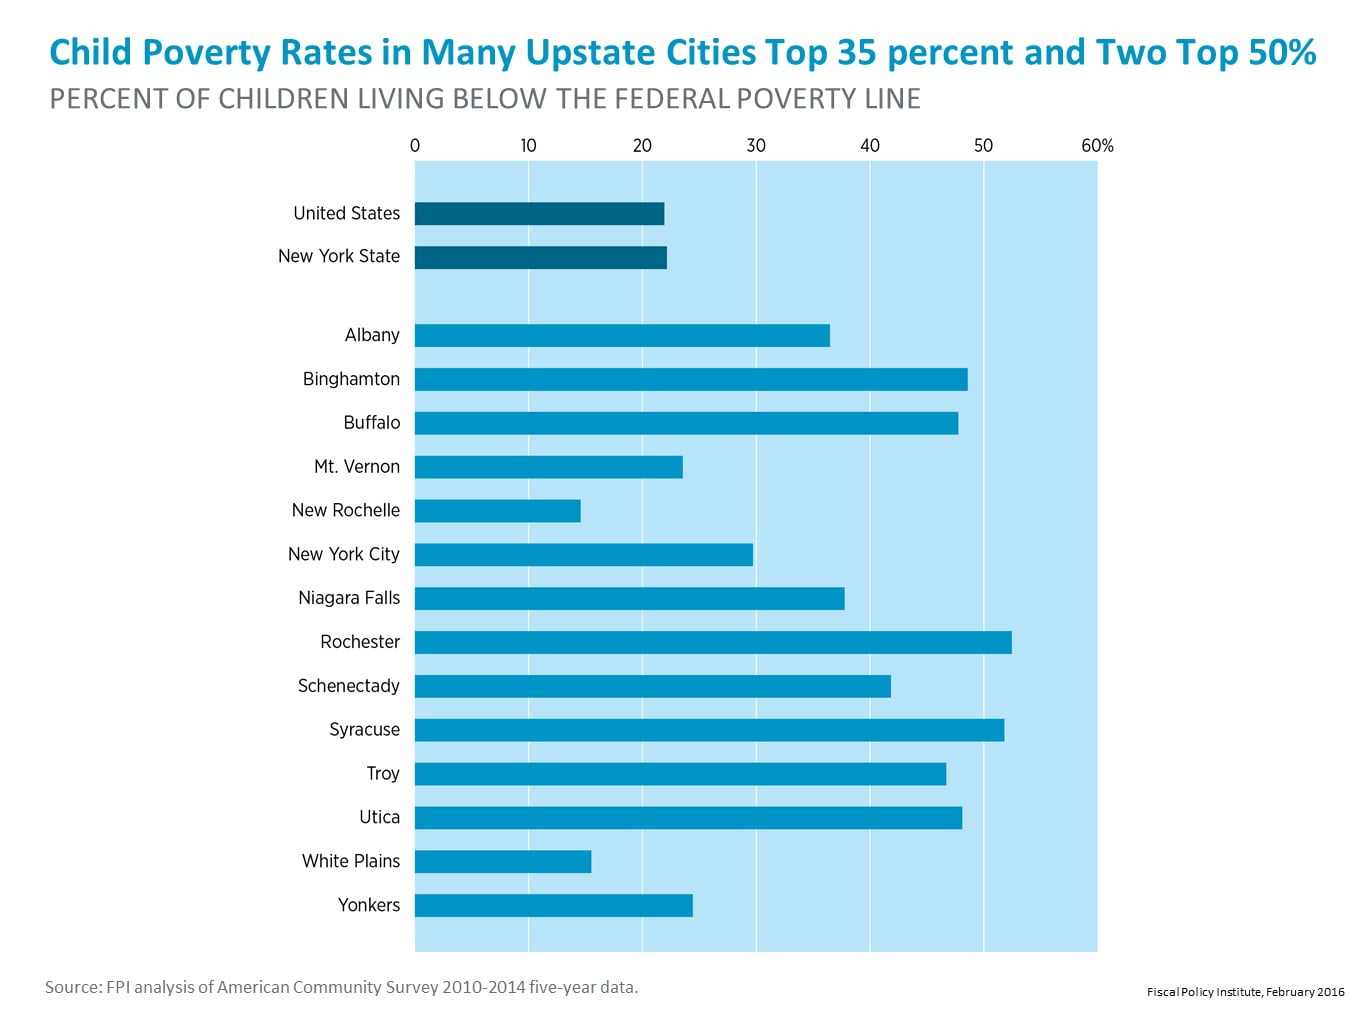
Fig 19. Child Poverty Rates in Many Upstate Cities Top 35 Percent and Two Top 50% – Page 44
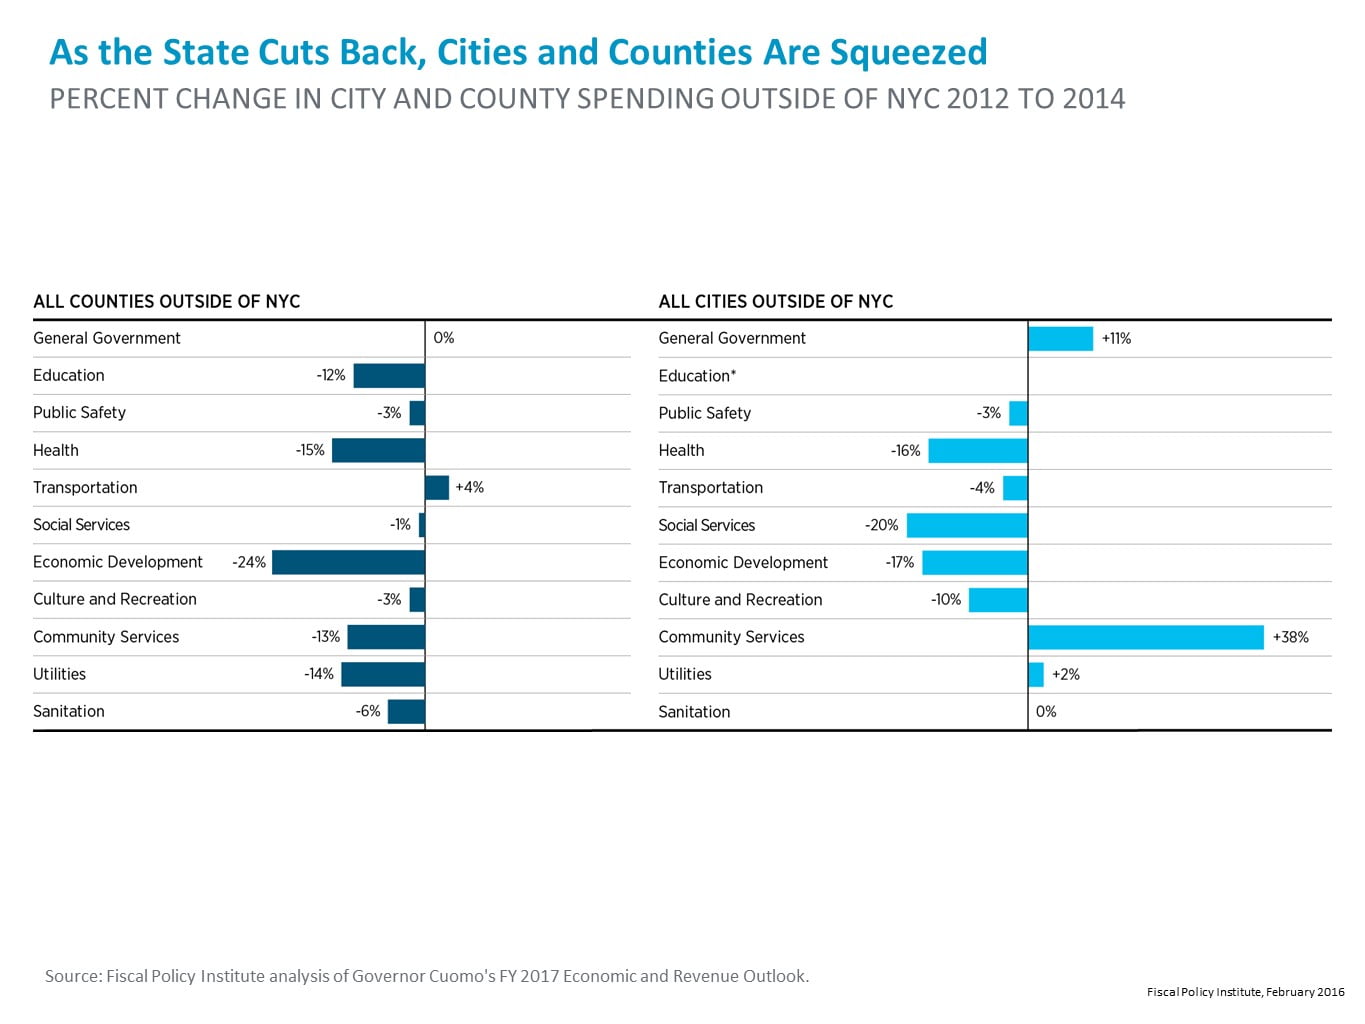
Fig 20. As the State Cuts Back, Cities and Counties are Squeezed – Page 47
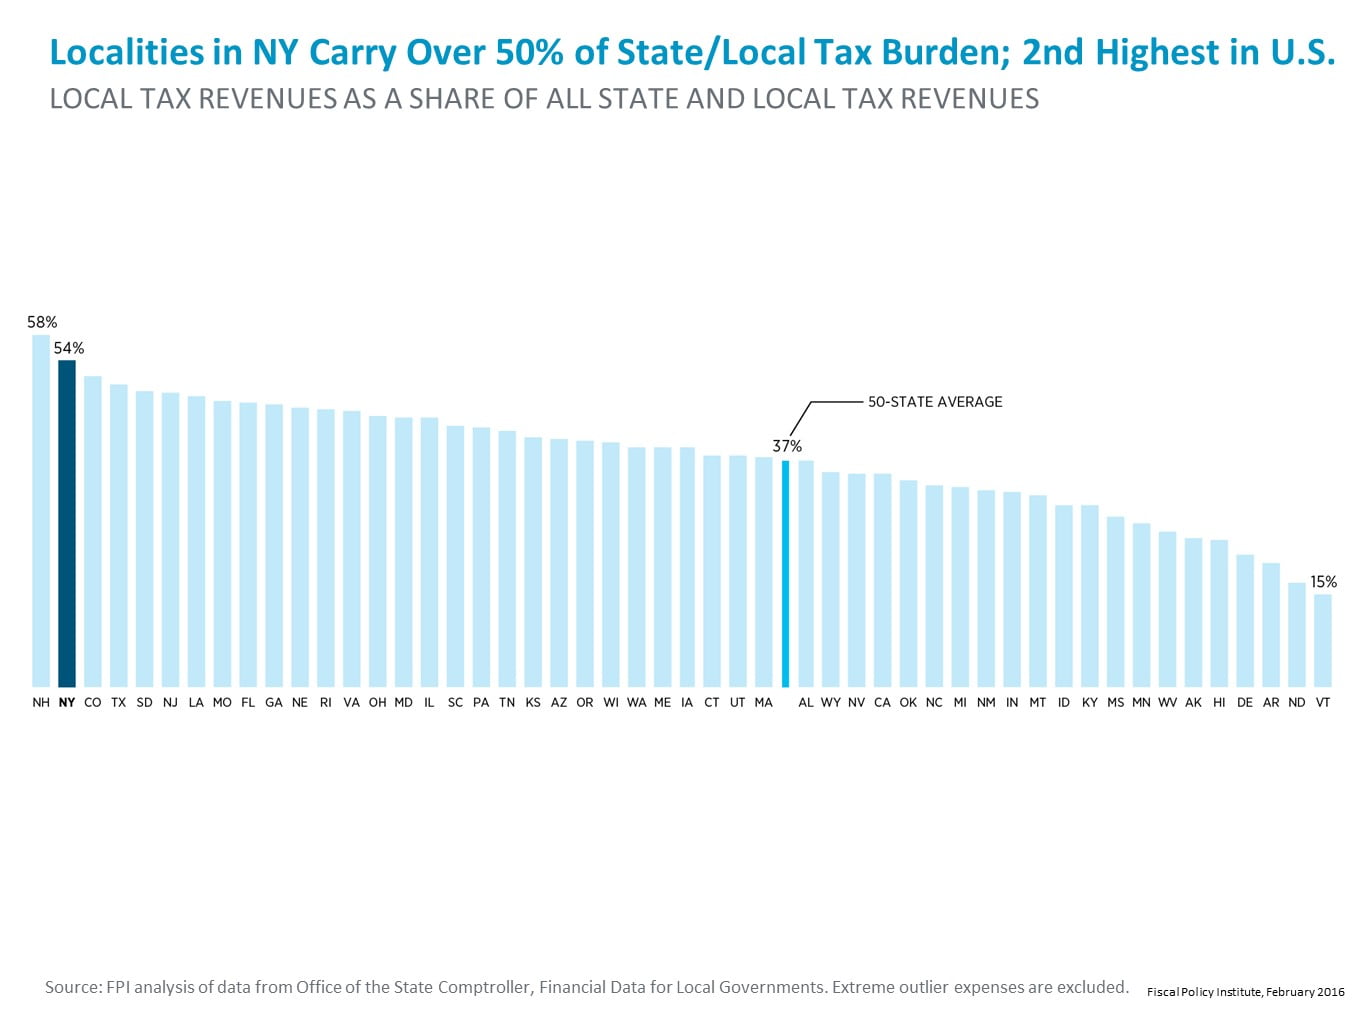
Fig 22. Localities in NY Carry Over 50% of State/Local Tax Burden; 2nd Highest in US – Page 49