House and Senate Tax Bill Will Hurt New York’s Poorest Taxpayers and Result in Many Losing Health Coverage
December 8, 2017 |
December 2017, House and Senate Tax Bill Will Hurt New York’s Poorest Taxpayers and Result in Many Losing Health Coverage
Impact of Tax Cuts to New Yorkers (Both Bills)
The Institute on Taxation and Economic Policy (ITEP) released its analysis of both the House and Senate tax bills for all fifty states. Both bills would raise taxes on many lower- and middle-income families in every state and provide the wealthiest Americans and foreign investors substantial tax cuts, while adding more than $1.4 trillion to the deficit over ten years. The graph below shows the share of the tax cuts by New York’s taxpayers, with the poorest 20 percent of income earners receiving 1-2 percent of all the tax cuts and the top 5 percent of income earners receiving over 40 percent of the tax cuts with both plans.[1]
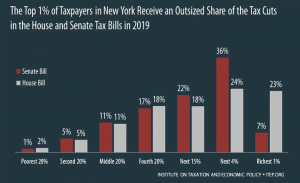
Under the Senate bill, when fully implemented, the bottom 60 percent of New Yorkers will see a tax increase.

Based on these graphs, it is crystal clear that the wealthiest New Yorkers will receive a massive tax cut while working families and children will lose out.

Impact on Healthcare: Repeal of the Individual Mandate (Senate Tax Bill)
The Senate dealt a massive blow to healthcare by repealing the individual coverage mandate as part of its tax bill. The Congressional Budget Office (CBO) has estimated that the repeal of the mandate will result in millions more uninsured over the next decade, regardless of whether Congress approves a market stabilization package. The Center for American Progress recently published estimates of the increase in uninsured by Congressional District under the Senate GOP tax bill.[2] According to these estimates, the collective impact of uninsured by 2025 for New York State would be approximately 843,000 people. This group includes Medicaid recipients, people with insurance from the individual market, and folks with employer-sponsored insurance. A major portion of the newly uninsured would come from the individual market, where the mandate repeal would raise premiums and drive some people out of coverage altogether.
| Representative | Total Coverage Reduction | Medicaid | Individual Market | Employer-Sponsored Insurance |
| Lee M. Zeldin (NY-1) | 43,000 | 13,800 | 26,200 | 3,100 |
| Peter T. King (NY-2) | 19,100 | 14,300 | 1,800 | 3,000 |
| Thomas R. Suozzi (NY-3) | 45,100 | 13,700 | 28,000 | 3,500 |
| Kathleen M. Rice (NY-4) | 72,100 | 14,100 | 22,800 | 35,300 |
| Gregory W. Meeks (NY-5) | 42,100 | 16,100 | 23,800 | 2,100 |
| Grace Meng (NY-6) | 39,800 | 14,800 | 22,800 | 2,100 |
| Nydia M. Velázquez (NY-7) | 35,200 | 15,900 | 2,800 | 16,400 |
| Hakeem S. Jeffries (NY-8) | 49,600 | 15,500 | 32,200 | 1,900 |
| Yvette D. Clarke (NY-9) | 44,000 | 14,900 | 27,200 | 1,900 |
| Jerrold Nadler (NY-10) | 37,400 | 14,100 | 5,300 | 18,000 |
| Daniel M. Donovan, Jr. (NY-11) | 18,900 | 14,500 | 1,700 | 2,700 |
| Carolyn B. Maloney (NY-12) | 40,300 | 14,200 | 6,600 | 19,400 |
| Adriano Espaillat (NY-13) | 21,400 | 16,700 | 3,300 | 1,400 |
| Joseph Crowley (NY-14) | 36,000 | 13,700 | 20,900 | 1,300 |
| José E. Serrano (NY-15) | 18,100 | 16,300 | 1,700 | 100 |
| Eliot L. Engel (NY-16) | 18,800 | 14,200 | 1,900 | 2,600 |
| Nita M. Lowey (NY-17) | 34,600 | 14,600 | 17,100 | 2,900 |
| Sean Patrick Maloney (NY-18) | 19,200 | 14,100 | 1,900 | 3,100 |
| John J. Faso (NY-19) | 17,300 | 12,900 | 2,200 | 2,200 |
| Paul Tonko (NY-20) | 40,700 | 14,100 | 3,100 | 23,600 |
| Elise M. Stefanik (NY-21) | 17,500 | 13,100 | 2,500 | 2,000 |
| Claudia Tenney (NY-22) | 17,700 | 13,300 | 2,300 | 2,100 |
| Tom Reed (NY-23) | 18,700 | 13,300 | 3,400 | 2,000 |
| John Katko (NY-24) | 18,300 | 13,700 | 2,200 | 2,400 |
| Louise Slaughter (NY-25) | 42,100 | 14,000 | 3,100 | 25,000 |
| Brian Higgins (NY-26) | 17,900 | 13,800 | 2,200 | 1,900 |
| Chris Collins (NY-27) | 18,100 | 13,500 | 1,500 | 3,100 |
| Total | 843,000 | 387,200 | 270,500 | 185,100 |
Partial Repeal of Federal Income Tax Deduction for SALT (State and Local Taxes)
The SALT deduction lets taxpayers deduct their state and local income or sales taxes, whichever are greater, and their state and local property taxes. The House and Senate tax bills both fully eliminate SALT deductions for income or sales taxes, and cap the deduction for property taxes at $10,000. Retaining a limited SALT deduction for property taxes does little to protect state budgets from the strain that fully repealing SALT would produce. Thus, eliminating the income or sales tax deduction would likely lead over time to cuts in state funding for schools, healthcare, and other services on which middle- and lower-income families rely. The Center on Budget and Policy Priorities has created an interactive map of all fifty states with information on the SALT deduction by Congressional District, which has been transposed into a table below with SALT information for all of New York’s 27 Congressional Districts.[3]
| Representative
|
Total Count of State Tax Returns
|
State/Local Income and Sales Tax Deduction
|
Total SALT Deductions
|
Income/Sales Deduction as Percent of Total SALT Deduction
|
||||
| # of Returns | Amount Deducted ($1000s) | % of All Returns | # of Returns | Amount Deducted ($1000s) | % of All Returns | |||
| Lee M. Zeldin (NY-1) | 353,170 | 165,790 | $1,555,078 | 46.9% | 168,256 | $3,006,503 | 47.6% | 51.7% |
| Peter T. King (NY-2) | 379,732 | 170,484 | $1,114,060 | 44.9% | 172,991 | $2,633,817 | 45.6% | 42.3% |
| Thomas R. Suozzi (NY-3) | 364,374 | 196,677 | $3,555,236 | 54% | 199,084 | $5,978,112 | 54.6% | 59.5% |
| Kathleen M. Rice (NY-4) | 377,536 | 182,166 | $1,802,117 | 48.3% | 184,824 | $3,574,029 | 49% | 50.4% |
| Gregory W. Meeks (NY-5) | 362,821 | 122,416 | $819,144 | 33.7% | 124,566 | $1,227,476 | 34.3% | 66.7% |
| Grace Meng (NY-6) | 369,321 | 109,182 | $1,074,559 | 29.6% | 110,515 | $1,449,292 | 29.9% | 74.1% |
| Nydia M. Velázquez (NY-7) | 353,774 | 95,737 | $1,935,744 | 27.1% | 96,599 | $2,157,735 | 27.3% | 89.7% |
| Hakeem S. Jeffries (NY-8) | 350,411 | 103,361 | $1,001,769 | 29.5% | 104,670 | $1,228,059 | 29.9% | 81.6% |
| Yvette D. Clarke (NY-9) | 349,294 | 99,758 | $1,198,079 | 28.6% | 101,015 | $1,421,876 | 28.9% | 84.3% |
| Jerrold Nadler (NY-10) | 365,864 | 165,791 | $8,257,164 | 45.3% | 167,014 | $9,243,255 | 45.6% | 89.3% |
| Daniel M. Donovan, Jr. (NY-11) | 335,049 | 132,082 | $1,460,370 | 39.4% | 133,337 | $1,967,332 | 39.8% | 74.2% |
| Carolyn B. Maloney (NY-12) | 406,117 | 209,400 | $12,002,312 | 51.6% | 210,878 | $13,394,811 | 51.9% | 89.6% |
| Adriano Espaillat (NY-13) | 356,703 | 80,080 | $889,309 | 22.5% | 80,854 | $1,008,516 | 22.7% | 88.2% |
| Joseph Crowley (NY-14) | 350,853 | 87,964 | $668,177 | 25.1% | 88,939 | $847,608 | 25.3% | 78.8% |
| José E. Serrano (NY-15) | 331,497 | 50,198 | $251,625 | 15.1% | 50,800 | $292,755 | 15.3% | 86% |
| Eliot L. Engel (NY-16) | 357,009 | 141,694 | $2,814,651 | 39.7% | 143,754 | $4,126,824 | 40.3% | 68.2% |
| Nita M. Lowey (NY-17) | 352,432 | 166,496 | $2,632,760 | 47.2% | 168,766 | $4,550,002 | 47.9% | 57.9% |
| Sean Patrick Maloney (NY-18) | 338,267 | 146,226 | $1,513,438 | 43.2% | 148,556 | $2,833,681 | 43.9% | 53.4% |
| John J. Faso (NY-19) | 314,540 | 99,052 | $683,233 | 31.5% | 102,819 | $1,368,035 | 32.7% | 49.9% |
| Paul Tonko (NY-20) | 356,738 | 119,038 | $1,040,835 | 33.4% | 122,114 | $1,800,020 | 34.2% | 57.8% |
| Elise M. Stefanik (NY-21) | 310,498 | 67,564 | $459,641 | 21.8% | 70,671 | $805,662 | 22.8% | 57.1% |
| Claudia Tenney (NY-22) | 308,959 | 67,791 | $429,675 | 21.9% | 70,870 | $803,802 | 22.9% | 53.5% |
| Tom Reed (NY-23) | 301,876 | 62,449 | $405,448 | 20.7% | 64,926 | $758,826 | 21.5% | 53.4% |
| John Katko (NY-24) | 330,286 | 96,273 | $652,766 | 29.1% | 97,898 | $1,239,951 | 29.6% | 52.6% |
| Louise McIntosh Slaughter (NY-25) | 345,864 | 113,490 | $823,455 | 32.8% | 115,047 | $1,563,384 | 33.3% | 52.7% |
| Brian Higgins (NY-26) | 337,775 | 78,057 | $526,949 | 23.1% | 79,400 | $911,206 | 23.5% | 57.8% |
| Chris Collins (NY-27) | 347,618 | 109,165 | $791,535 | 31.4% | 111,175 | $1,442,105 | 32% | 54.9% |
Access to PDF File HERE
House and Senate Tax Bill Will Hurt New York’s Poorest Taxpayers and Result in Many Losing Health Coverage
December 8, 2017 |
December 2017, House and Senate Tax Bill Will Hurt New York’s Poorest Taxpayers and Result in Many Losing Health Coverage
Impact of Tax Cuts to New Yorkers (Both Bills)
The Institute on Taxation and Economic Policy (ITEP) released its analysis of both the House and Senate tax bills for all fifty states. Both bills would raise taxes on many lower- and middle-income families in every state and provide the wealthiest Americans and foreign investors substantial tax cuts, while adding more than $1.4 trillion to the deficit over ten years. The graph below shows the share of the tax cuts by New York’s taxpayers, with the poorest 20 percent of income earners receiving 1-2 percent of all the tax cuts and the top 5 percent of income earners receiving over 40 percent of the tax cuts with both plans.[1]
Under the Senate bill, when fully implemented, the bottom 60 percent of New Yorkers will see a tax increase.
Based on these graphs, it is crystal clear that the wealthiest New Yorkers will receive a massive tax cut while working families and children will lose out.
Impact on Healthcare: Repeal of the Individual Mandate (Senate Tax Bill)
The Senate dealt a massive blow to healthcare by repealing the individual coverage mandate as part of its tax bill. The Congressional Budget Office (CBO) has estimated that the repeal of the mandate will result in millions more uninsured over the next decade, regardless of whether Congress approves a market stabilization package. The Center for American Progress recently published estimates of the increase in uninsured by Congressional District under the Senate GOP tax bill.[2] According to these estimates, the collective impact of uninsured by 2025 for New York State would be approximately 843,000 people. This group includes Medicaid recipients, people with insurance from the individual market, and folks with employer-sponsored insurance. A major portion of the newly uninsured would come from the individual market, where the mandate repeal would raise premiums and drive some people out of coverage altogether.
| Representative | Total Coverage Reduction | Medicaid | Individual Market | Employer-Sponsored Insurance |
| Lee M. Zeldin (NY-1) | 43,000 | 13,800 | 26,200 | 3,100 |
| Peter T. King (NY-2) | 19,100 | 14,300 | 1,800 | 3,000 |
| Thomas R. Suozzi (NY-3) | 45,100 | 13,700 | 28,000 | 3,500 |
| Kathleen M. Rice (NY-4) | 72,100 | 14,100 | 22,800 | 35,300 |
| Gregory W. Meeks (NY-5) | 42,100 | 16,100 | 23,800 | 2,100 |
| Grace Meng (NY-6) | 39,800 | 14,800 | 22,800 | 2,100 |
| Nydia M. Velázquez (NY-7) | 35,200 | 15,900 | 2,800 | 16,400 |
| Hakeem S. Jeffries (NY-8) | 49,600 | 15,500 | 32,200 | 1,900 |
| Yvette D. Clarke (NY-9) | 44,000 | 14,900 | 27,200 | 1,900 |
| Jerrold Nadler (NY-10) | 37,400 | 14,100 | 5,300 | 18,000 |
| Daniel M. Donovan, Jr. (NY-11) | 18,900 | 14,500 | 1,700 | 2,700 |
| Carolyn B. Maloney (NY-12) | 40,300 | 14,200 | 6,600 | 19,400 |
| Adriano Espaillat (NY-13) | 21,400 | 16,700 | 3,300 | 1,400 |
| Joseph Crowley (NY-14) | 36,000 | 13,700 | 20,900 | 1,300 |
| José E. Serrano (NY-15) | 18,100 | 16,300 | 1,700 | 100 |
| Eliot L. Engel (NY-16) | 18,800 | 14,200 | 1,900 | 2,600 |
| Nita M. Lowey (NY-17) | 34,600 | 14,600 | 17,100 | 2,900 |
| Sean Patrick Maloney (NY-18) | 19,200 | 14,100 | 1,900 | 3,100 |
| John J. Faso (NY-19) | 17,300 | 12,900 | 2,200 | 2,200 |
| Paul Tonko (NY-20) | 40,700 | 14,100 | 3,100 | 23,600 |
| Elise M. Stefanik (NY-21) | 17,500 | 13,100 | 2,500 | 2,000 |
| Claudia Tenney (NY-22) | 17,700 | 13,300 | 2,300 | 2,100 |
| Tom Reed (NY-23) | 18,700 | 13,300 | 3,400 | 2,000 |
| John Katko (NY-24) | 18,300 | 13,700 | 2,200 | 2,400 |
| Louise Slaughter (NY-25) | 42,100 | 14,000 | 3,100 | 25,000 |
| Brian Higgins (NY-26) | 17,900 | 13,800 | 2,200 | 1,900 |
| Chris Collins (NY-27) | 18,100 | 13,500 | 1,500 | 3,100 |
| Total | 843,000 | 387,200 | 270,500 | 185,100 |
Partial Repeal of Federal Income Tax Deduction for SALT (State and Local Taxes)
The SALT deduction lets taxpayers deduct their state and local income or sales taxes, whichever are greater, and their state and local property taxes. The House and Senate tax bills both fully eliminate SALT deductions for income or sales taxes, and cap the deduction for property taxes at $10,000. Retaining a limited SALT deduction for property taxes does little to protect state budgets from the strain that fully repealing SALT would produce. Thus, eliminating the income or sales tax deduction would likely lead over time to cuts in state funding for schools, healthcare, and other services on which middle- and lower-income families rely. The Center on Budget and Policy Priorities has created an interactive map of all fifty states with information on the SALT deduction by Congressional District, which has been transposed into a table below with SALT information for all of New York’s 27 Congressional Districts.[3]
| Representative
|
Total Count of State Tax Returns
|
State/Local Income and Sales Tax Deduction
|
Total SALT Deductions
|
Income/Sales Deduction as Percent of Total SALT Deduction
|
||||
| # of Returns | Amount Deducted ($1000s) | % of All Returns | # of Returns | Amount Deducted ($1000s) | % of All Returns | |||
| Lee M. Zeldin (NY-1) | 353,170 | 165,790 | $1,555,078 | 46.9% | 168,256 | $3,006,503 | 47.6% | 51.7% |
| Peter T. King (NY-2) | 379,732 | 170,484 | $1,114,060 | 44.9% | 172,991 | $2,633,817 | 45.6% | 42.3% |
| Thomas R. Suozzi (NY-3) | 364,374 | 196,677 | $3,555,236 | 54% | 199,084 | $5,978,112 | 54.6% | 59.5% |
| Kathleen M. Rice (NY-4) | 377,536 | 182,166 | $1,802,117 | 48.3% | 184,824 | $3,574,029 | 49% | 50.4% |
| Gregory W. Meeks (NY-5) | 362,821 | 122,416 | $819,144 | 33.7% | 124,566 | $1,227,476 | 34.3% | 66.7% |
| Grace Meng (NY-6) | 369,321 | 109,182 | $1,074,559 | 29.6% | 110,515 | $1,449,292 | 29.9% | 74.1% |
| Nydia M. Velázquez (NY-7) | 353,774 | 95,737 | $1,935,744 | 27.1% | 96,599 | $2,157,735 | 27.3% | 89.7% |
| Hakeem S. Jeffries (NY-8) | 350,411 | 103,361 | $1,001,769 | 29.5% | 104,670 | $1,228,059 | 29.9% | 81.6% |
| Yvette D. Clarke (NY-9) | 349,294 | 99,758 | $1,198,079 | 28.6% | 101,015 | $1,421,876 | 28.9% | 84.3% |
| Jerrold Nadler (NY-10) | 365,864 | 165,791 | $8,257,164 | 45.3% | 167,014 | $9,243,255 | 45.6% | 89.3% |
| Daniel M. Donovan, Jr. (NY-11) | 335,049 | 132,082 | $1,460,370 | 39.4% | 133,337 | $1,967,332 | 39.8% | 74.2% |
| Carolyn B. Maloney (NY-12) | 406,117 | 209,400 | $12,002,312 | 51.6% | 210,878 | $13,394,811 | 51.9% | 89.6% |
| Adriano Espaillat (NY-13) | 356,703 | 80,080 | $889,309 | 22.5% | 80,854 | $1,008,516 | 22.7% | 88.2% |
| Joseph Crowley (NY-14) | 350,853 | 87,964 | $668,177 | 25.1% | 88,939 | $847,608 | 25.3% | 78.8% |
| José E. Serrano (NY-15) | 331,497 | 50,198 | $251,625 | 15.1% | 50,800 | $292,755 | 15.3% | 86% |
| Eliot L. Engel (NY-16) | 357,009 | 141,694 | $2,814,651 | 39.7% | 143,754 | $4,126,824 | 40.3% | 68.2% |
| Nita M. Lowey (NY-17) | 352,432 | 166,496 | $2,632,760 | 47.2% | 168,766 | $4,550,002 | 47.9% | 57.9% |
| Sean Patrick Maloney (NY-18) | 338,267 | 146,226 | $1,513,438 | 43.2% | 148,556 | $2,833,681 | 43.9% | 53.4% |
| John J. Faso (NY-19) | 314,540 | 99,052 | $683,233 | 31.5% | 102,819 | $1,368,035 | 32.7% | 49.9% |
| Paul Tonko (NY-20) | 356,738 | 119,038 | $1,040,835 | 33.4% | 122,114 | $1,800,020 | 34.2% | 57.8% |
| Elise M. Stefanik (NY-21) | 310,498 | 67,564 | $459,641 | 21.8% | 70,671 | $805,662 | 22.8% | 57.1% |
| Claudia Tenney (NY-22) | 308,959 | 67,791 | $429,675 | 21.9% | 70,870 | $803,802 | 22.9% | 53.5% |
| Tom Reed (NY-23) | 301,876 | 62,449 | $405,448 | 20.7% | 64,926 | $758,826 | 21.5% | 53.4% |
| John Katko (NY-24) | 330,286 | 96,273 | $652,766 | 29.1% | 97,898 | $1,239,951 | 29.6% | 52.6% |
| Louise McIntosh Slaughter (NY-25) | 345,864 | 113,490 | $823,455 | 32.8% | 115,047 | $1,563,384 | 33.3% | 52.7% |
| Brian Higgins (NY-26) | 337,775 | 78,057 | $526,949 | 23.1% | 79,400 | $911,206 | 23.5% | 57.8% |
| Chris Collins (NY-27) | 347,618 | 109,165 | $791,535 | 31.4% | 111,175 | $1,442,105 | 32% | 54.9% |
Access to PDF File HERE