New poverty and income inequality data should be a call to action
September 21, 2012 |
 September 21, 2012. Data released by the Census Bureau yesterday casts additional light on New York’s high poverty rate and its extreme income inequality. The poverty situation is particularly dire in the Upstate cities and among children. When those two factors are looked at together, alarm bells should be going off in policymakers’ offices.
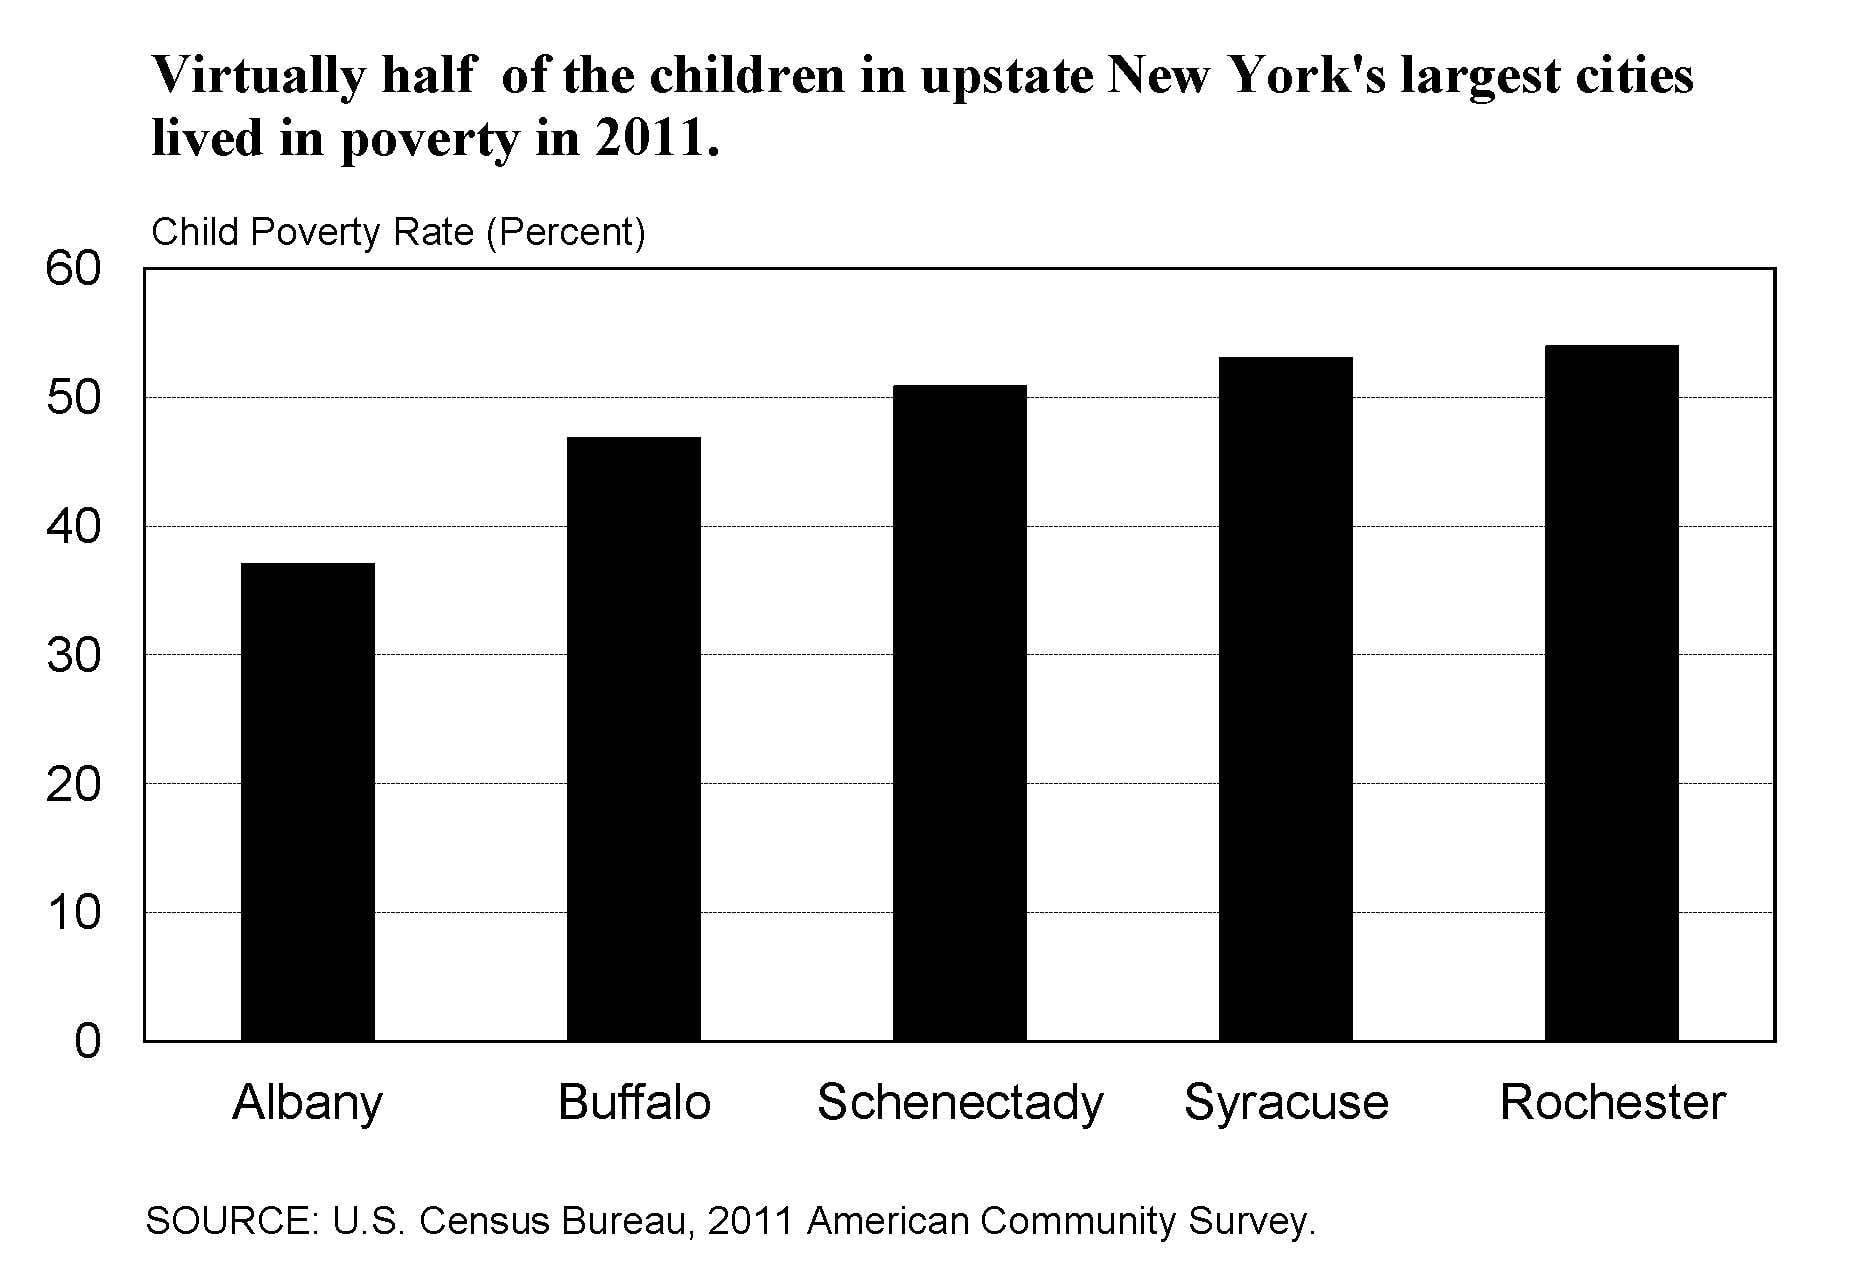
More than half the children in Rochester and Syracuse lived in poverty in 2011 and Buffalo (46.8%), Schenectady (50.8%) and Albany (37%) were not far behind. See Table 1 for the overall family and individual poverty rates, and for the poverty rates for major age groups and two family types, for the 30 cities and towns, and five New York City boroughs in the state covered by the data (i.e., communities with populations of 65,000 or more).
Table 2 has the overall poverty rates and the child poverty rates for the 39 counties covered by the new data. Tables 1 and 2 both show the great differences that exist within New York State in terms of economic status. For the 30 large cities and towns, the overall poverty rates ranged from 3.2% in the Town of Oyster Bay to 36.7% in the City of Syracuse. For the 39 large counties, the poverty rate ranged from a low of 5.8% in Putnam County to 30.4% in the Bronx. Three Upstate counties had poverty rates estimated to be above 20% – Oswego and Tompkins at 21% and 20.2% in Chautauqua County. (The Tompkins county figure is somewhat anomalous because of the large numbers of graduate and undergraduate students living in Ithaca.)
Statewide, New York’s poverty rate increased from an estimated 14.9% in 2010 to an estimated 16% in 2011. This raised the number of persons living in poverty in New York State by 206,000 to slightly over 3 million. According to the Census Bureau, New York was one of 16 states with statistically significant increases in this measure of the percentage of the population living below the poverty line. The state level information on poverty is summarized in a new Census Bureau report. The increase in the national poverty rate was also statistically significant, up from 15.3% to 15.9%.
The information released yesterday is from the Census Bureau’s 2011 American Community Survey. Frequently referred to as the ACS, this survey provides data for the nation, all 50 states, the District of Columbia, Puerto Rico, every congressional district, every metropolitan area, and all counties and places with populations of 65,000 or more.
Since 2006, the ACS has been reporting an estimated Gini index of inequality for states, cities, and other governmental jurisdictions. The Gini index measures the inequality of incomes for a given area in a range from zero (all incomes are equal) to one (one household has all the income). The higher the index value, the greater the degree of inequality. For the years 2006-2010, New York State had the highest Gini index value among all states, indicating the greatest degree of inequality. In the new 2011 estimates (Table 3), New York again ranks first followed by Connecticut, Louisiana, and New Mexico. Wyoming had the lowest estimated degree of income inequality.

New poverty and income inequality data should be a call to action
September 21, 2012 |
 September 21, 2012. Data released by the Census Bureau yesterday casts additional light on New York’s high poverty rate and its extreme income inequality. The poverty situation is particularly dire in the Upstate cities and among children. When those two factors are looked at together, alarm bells should be going off in policymakers’ offices.
More than half the children in Rochester and Syracuse lived in poverty in 2011 and Buffalo (46.8%), Schenectady (50.8%) and Albany (37%) were not far behind. See Table 1 for the overall family and individual poverty rates, and for the poverty rates for major age groups and two family types, for the 30 cities and towns, and five New York City boroughs in the state covered by the data (i.e., communities with populations of 65,000 or more).
Table 2 has the overall poverty rates and the child poverty rates for the 39 counties covered by the new data. Tables 1 and 2 both show the great differences that exist within New York State in terms of economic status. For the 30 large cities and towns, the overall poverty rates ranged from 3.2% in the Town of Oyster Bay to 36.7% in the City of Syracuse. For the 39 large counties, the poverty rate ranged from a low of 5.8% in Putnam County to 30.4% in the Bronx. Three Upstate counties had poverty rates estimated to be above 20% – Oswego and Tompkins at 21% and 20.2% in Chautauqua County. (The Tompkins county figure is somewhat anomalous because of the large numbers of graduate and undergraduate students living in Ithaca.)
Statewide, New York’s poverty rate increased from an estimated 14.9% in 2010 to an estimated 16% in 2011. This raised the number of persons living in poverty in New York State by 206,000 to slightly over 3 million. According to the Census Bureau, New York was one of 16 states with statistically significant increases in this measure of the percentage of the population living below the poverty line. The state level information on poverty is summarized in a new Census Bureau report. The increase in the national poverty rate was also statistically significant, up from 15.3% to 15.9%.
The information released yesterday is from the Census Bureau’s 2011 American Community Survey. Frequently referred to as the ACS, this survey provides data for the nation, all 50 states, the District of Columbia, Puerto Rico, every congressional district, every metropolitan area, and all counties and places with populations of 65,000 or more.
Since 2006, the ACS has been reporting an estimated Gini index of inequality for states, cities, and other governmental jurisdictions. The Gini index measures the inequality of incomes for a given area in a range from zero (all incomes are equal) to one (one household has all the income). The higher the index value, the greater the degree of inequality. For the years 2006-2010, New York State had the highest Gini index value among all states, indicating the greatest degree of inequality. In the new 2011 estimates (Table 3), New York again ranks first followed by Connecticut, Louisiana, and New Mexico. Wyoming had the lowest estimated degree of income inequality.
