February 19, 2014. A new report from the Economic Analysis and Research Network (EARN) that presents data on income distribution trends for all 50 states from 1917-2011, confirms an analysis of income trends in New York that the Fiscal Policy Institute initially published in 2010. The report, by economists Estelle Sommeiller and Mark Price, builds on a groundbreaking study by economists Thomas Piketty and Emmanual Saez in 2003 that used data from income tax returns to document rising inequality in the United States since World War I.
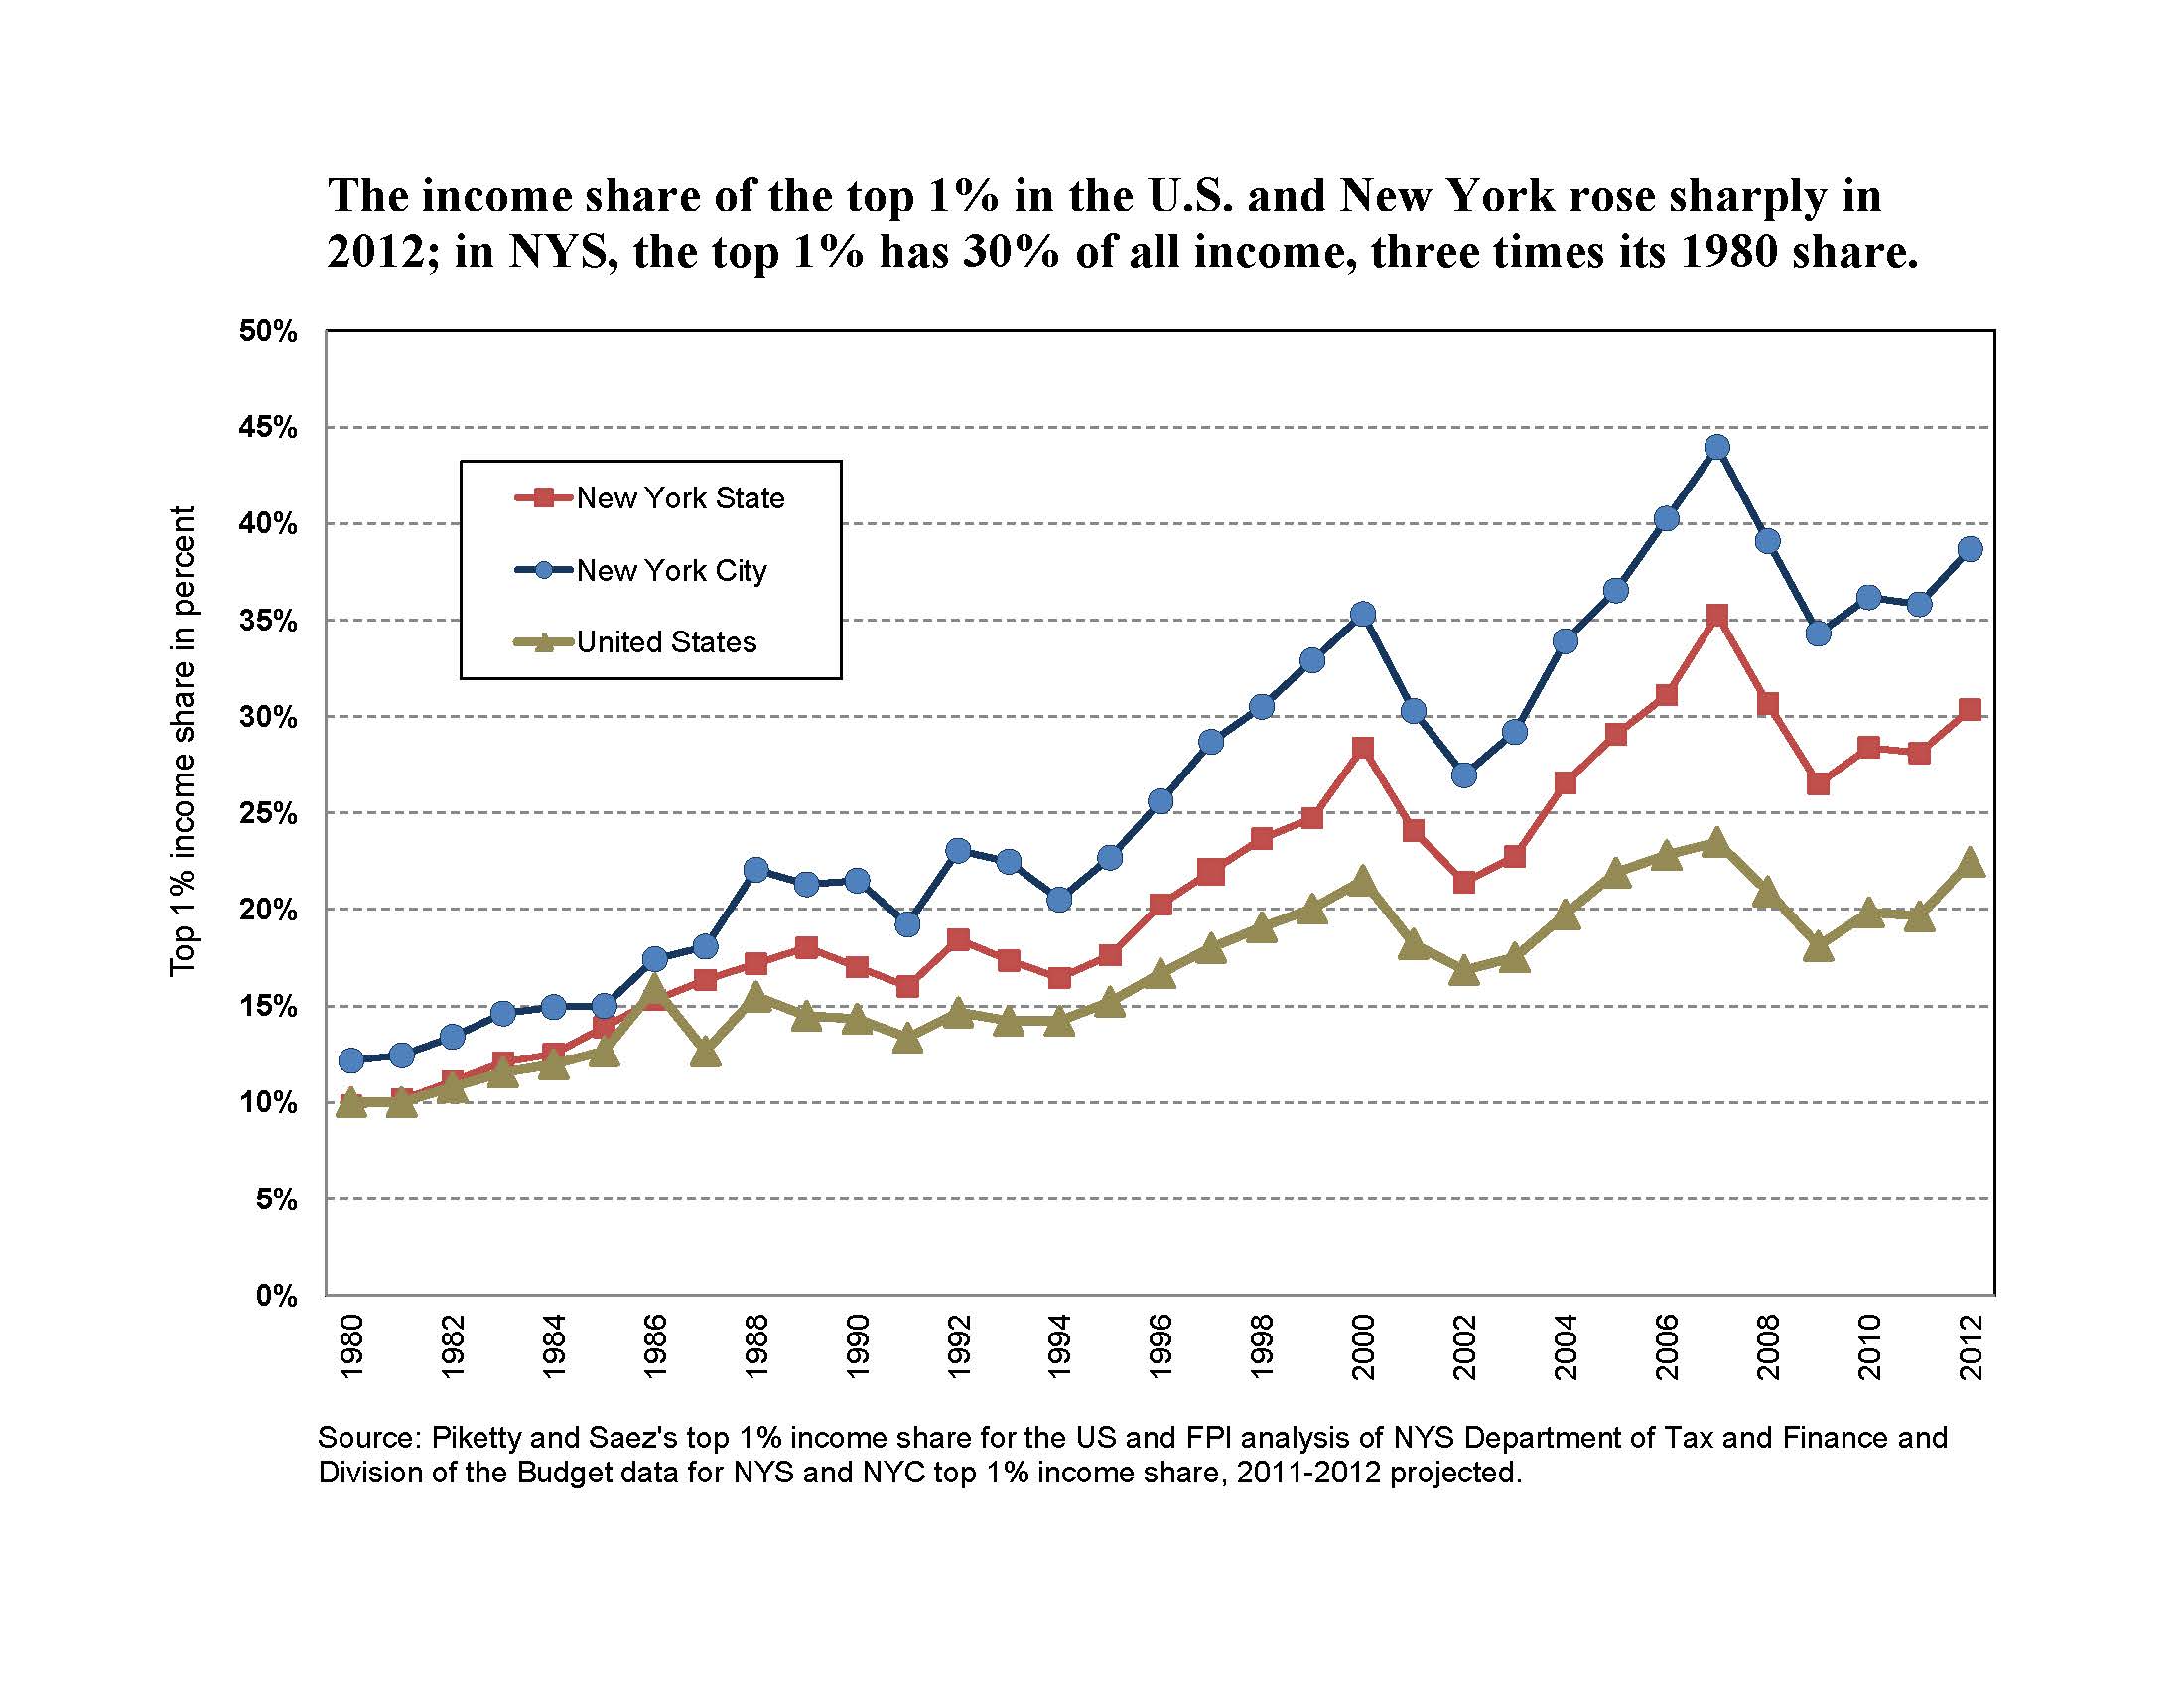
FPI’s latest estimates of the share of income received by the top 1% in New York were published recently in its briefing book (p. 77) on the Governor’s proposed 2014-2015 state budget. Using data from the proposed budget and the latest published tax data, FPI estimates that the top 1% share rose to 30.4% in New York State and 38.7% in New York City in 2012, compared to Saez’s latest estimate of 22.5% for the top 1% share nationally.
FPI’s estimates for New York’s income distribution date to 1980, the first year that detailed tax data are available from the New York State Department of Tax and Finance. The new Sommeiller and Price report draws on Internal Revenue Service tax data back to 1917. The IRS data are often less detailed in reporting on high incomes than New York tax data. Still, the Sommeiller-Price report is invaluable in providing comparable annual estimates for all states over a nearly century-long period, and presents that data in an easily accessible format where readers can view summary income trends for individual states.
Highlights for New York include:
- The top 1% income share rose to 32.6% in 2007, exceeding the previous peak of 29.4% reached in 1928, right before the stock market collapse triggering the Great Depression. While the one percent’s income share declined temporarily when capital gains plummeted from the 2008 financial collapse, it has risen again since 2009.
- According to the Sommeiller-Price data, the incomes of New York’s top 1% increased by 11 percent (inflation-adjusted) from 2009 to 2011, while the total incomes of the bottom 99% shrank by 1 percent. Thus, all of New York’s income growth in the recovery’s first two years went to the very top.
- Over the nearly 30-year span from 1979-2007, New York’s richest 1% garnered over two-thirds of all income gains; inflation-adjusted incomes grew by 355 percent over that span for the top 1%, compared to a 22 percent increase for the bottom 99%.
- In 2011, the average income of New York’s 1% was $1.7 million, over 40 times the $43,202 average income for the bottom 99%. The top-to-bottom ratio for the U.S. was 24 percent. Connecticut’s top-to-bottom ratio (40.6) was slightly ahead of New York’s (40.5). New Jersey’s top-to-bottom ratio (23.9) ranked it 10th greatest among states.
- The average income of New York’s very richest 1% of the top 1% was a shade under $50 million in 2011 ($49,737,418). The 1% of the 1% accounted for 8.3% of total New York income, more than one-fourth of the overall top 1% share.
The lop-sided growth in incomes seen in New York State since 1979 is true to some extent for all states, according to the new report, although it has been particularly pronounced in New York. The percentage point increase in the top 1% income share from 1979-2007 was 21.1 in New York, nearly twice the 11.8 percentage point increase in the top 1% share nationally.
FPI’s state budget briefing provides an overview of economic conditions in the Empire State, including income polarization, continued high unemployment, severe economic hardships, rising poverty and economic insecurity. FPI suggests several budget, tax and economic policy ideas that New York’s leaders should consider to address this heightened economic insecurity and the growing income polarization that has spawned that insecurity. See An Economic Policy Agenda to Address Income Inequality, pp. 83-89 in the budget briefing book.

