Tax Policy Brief: Estimating Revenue from a More Progressive Income Tax
March 10, 2023 |
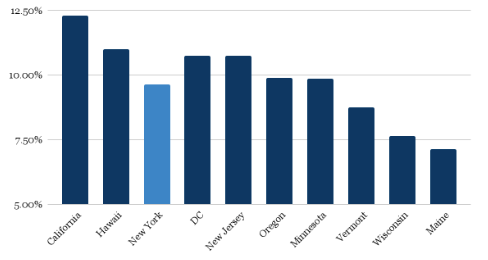
New York’s budget is largely funded through the state’s personal income tax (PIT). Between 2015 and 2020, state revenue from the personal income tax totaled between $47 billion and $55 billion annually. In 2021, the New York state legislature voted to create new PIT brackets for individuals earning over $1 million annually. This change created a more progressive state income tax system, so that those who earn more pay a larger share of their income in taxes. However, while New York’s PIT has one of the highest top rates in the country, New York still taxes millionaires at lower rates than many other states. Figures 1 and 2 show the top income tax rates for the ten states with the highest top income tax rates, which includes New York. However, when we look at how much New York taxes those making $1 million in income annually, we see that much of the high-earning New York population is actually taxed at far lower rates than comparable states.
Figure 1. New York is among the states with the highest top personal income tax rates, but it applies to less than .04 percent of taxpayers

New York’s top tax rate only applies to those earning over $25 million per year — less than 0.04 percent of taxpayers (fewer than 4 in 10,000 people). By contrast, other states impose their highest tax rate at much lower income levels. California’s top rate of 13.3 percent applies to single filers earning $1 million and married filers earning $1.35 million. Hawaii’s top tax rate of 11 percent applies to single filers earning $200,000 and married filers earning $400,000. The California and Hawaii tax structures are far more progressive, because the burden of higher taxes is borne by all high earners, not just the very rich.
Figure 2. New York’s tax rate on most millionaires is below comparable states
State legislators have proposed changes to the PIT that would both raise more tax revenue and increase the overall progressivity of the state tax system. This report estimates the revenue increases for four different changes to the PIT, including adding new brackets on high earners and increasing tax rates. We evaluate the impact of a new bracket on those earning over $500,000 annually, two options for moderately more progressive rates on high earners, and one very progressive proposal that has been introduced in both the Senate and Assembly (S2059/A3115). Overall we find that each proposal would raise over $1 billion in revenue annually and only impact the very affluent.
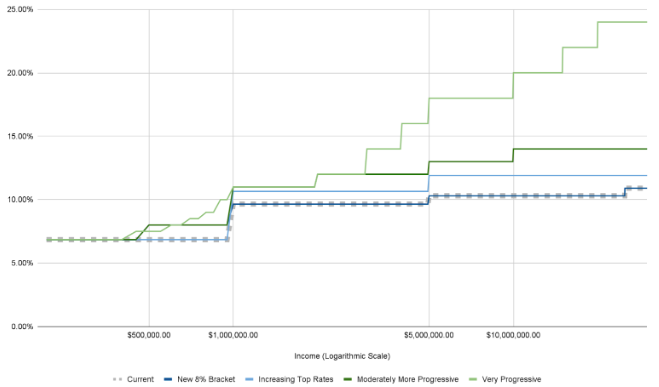
Figure 3 below illustrates the four tax structures (in blue and green) in comparison to the current tax structure (dashed gray). Under the current New York state tax code, an individual making $80,000 annually pays the same tax rate as an individual making $200,000 annually. Likewise, an individual making $300,000 annually pays the same tax rate as an individual making $1 million annually. The chart shows that each of the four proposed tax systems would make an overall more progressive tax landscape, meaning that individuals who make more money in a given year would also pay a higher share of their income in taxes:
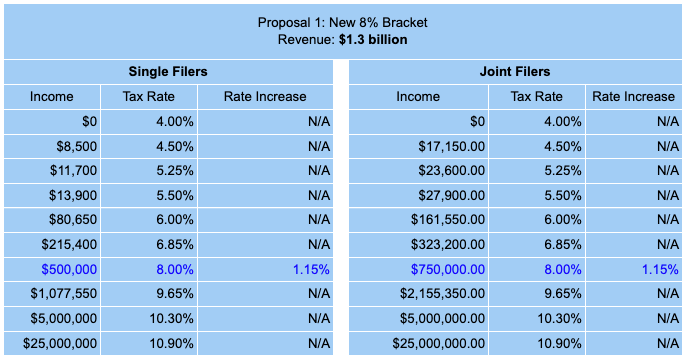
- Proposal 1 – New 8% bracket: Adds a new bracket for individuals making between $500,000 and $1.077 million (an increase of 1.15 percent) to evaluate the impact of creating brackets on high earners who are below the “millionaire” brackets.
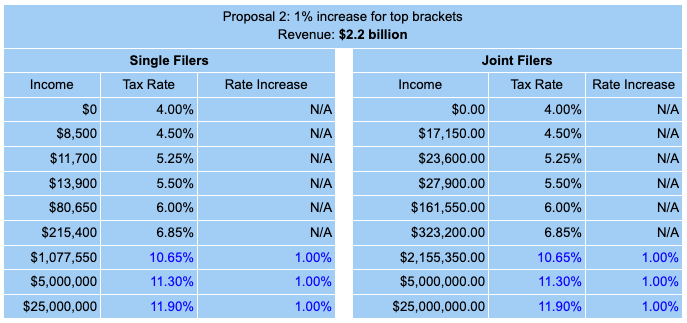
- Proposal 2 – Increase in top rate: Increases the tax rates on the current top brackets by 1 percent (those making over $1.077 million, $5 million, and $25 million).
- Proposal 3 – Moderately more progressive: Adds 2 new brackets for those making over $500,000 and increases top rate to 14 percent.
- Proposal 4 – Very progressive: Adds 7 new brackets and increases top rates significantly, with a top rate of 25 percent on those earning $20 million per year.
Figure 3. Proposed increases to the personal income tax in New York
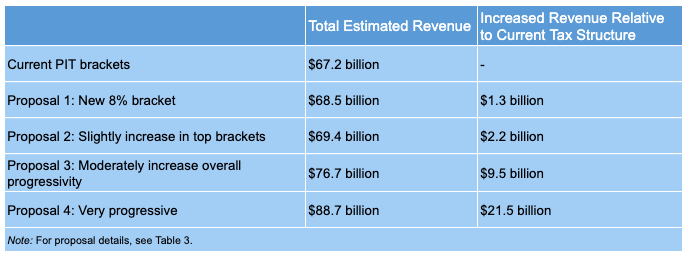
We estimate that creating a new 8 percent bracket at $500,000 for single filers adds about $1.3 billion in revenue annually, whereas increasing the top rates would add over $2 billion annually. Proposals 3 and 4 generate between $9.5 and $21.5 billion in new revenue annually by increasing rates on earners making over $500,000 each year.
Table 1. Revenue Estimates for personal income tax proposals in New York
To understand how the new taxes would impact different parts of the income distribution, we first see what the income distribution of tax filers is in New York. Households file their taxes according to their status as single, married, or head of household. The distribution of tax filers by status and income level is shown below. We can see that the modal household income in New York is between $80,000/year and $150,000/year. Almost 60 percent of tax filers in the state report annual income of less than $90,000 and about 98% of tax filers report income less than $500,000. Less than 1 percent of tax filers in New York state report income greater than $1 million.
Figure 4. Distribution of tax-filers in New York by income bracket and household type

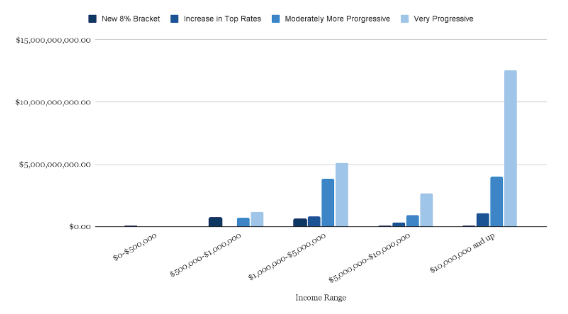
To understand how the proposed changes to the PIT would impact taxpayers in New York, we examine the change in tax revenue for each affected income group. For each of the four PIT proposals examined, we plot the change in total taxes paid by each income group. We can see that for the 98% of taxpayers making less than $500,000/year, there will be no change in tax burden. For each of the proposals (other than the proposal that only evaluates a new 8 percent bracket on those earning over $500,000) the majority of the group seeing the largest increase in tax burden would be those making over $10,000,000 in annual income.
Figure 5. Additional revenue raised across income groups by each proposed change
To evaluate the overall tax incidence, we examine the total revenue earned from taxing different income brackets. As shown below, a large and consistent component of each proposal is that there is significant revenue raised from the bottom 98% of the income distribution. We also see that the more progressive proposals draw more revenue from higher earners. Of particular note is the fact that the new 8% bracket proposal raises more from those earning between $500,000 and $1,000,000 than the proposal that raises rates on the very top earners. This feature is by design and represents the different versions of progressivity that could be implemented by state policymakers.
Figure 6. Total revenue raised across income groups for each proposal and the current PIT structure

Table 2. Current Personal Income Tax Brackets

Table 2. Current Personal Income Tax Brackets
Proposed Income Tax Changes
Blue text indicates new rates or brackets


Methodology
These estimates are based on 2019 New York tax data published by the Department of Tax and Finance. This is the most recent data available on tax revenue by income group, besides 2020 which has been deemed unrepresentative because of the Covid-19 pandemic. We inflate revenue numbers according to growth in incomes observed between 2019 and 2022. Revenue estimates also assume an even distribution of taxpayers across the income bins up to the top bins. In the top bins, we use the average reported earnings in the official tax data.
Tax Policy Brief: Estimating Revenue from a More Progressive Income Tax
March 10, 2023 |
New York’s budget is largely funded through the state’s personal income tax (PIT). Between 2015 and 2020, state revenue from the personal income tax totaled between $47 billion and $55 billion annually. In 2021, the New York state legislature voted to create new PIT brackets for individuals earning over $1 million annually. This change created a more progressive state income tax system, so that those who earn more pay a larger share of their income in taxes. However, while New York’s PIT has one of the highest top rates in the country, New York still taxes millionaires at lower rates than many other states. Figures 1 and 2 show the top income tax rates for the ten states with the highest top income tax rates, which includes New York. However, when we look at how much New York taxes those making $1 million in income annually, we see that much of the high-earning New York population is actually taxed at far lower rates than comparable states.
Figure 1. New York is among the states with the highest top personal income tax rates, but it applies to less than .04 percent of taxpayers

New York’s top tax rate only applies to those earning over $25 million per year — less than 0.04 percent of taxpayers (fewer than 4 in 10,000 people). By contrast, other states impose their highest tax rate at much lower income levels. California’s top rate of 13.3 percent applies to single filers earning $1 million and married filers earning $1.35 million. Hawaii’s top tax rate of 11 percent applies to single filers earning $200,000 and married filers earning $400,000. The California and Hawaii tax structures are far more progressive, because the burden of higher taxes is borne by all high earners, not just the very rich.
Figure 2. New York’s tax rate on most millionaires is below comparable states

State legislators have proposed changes to the PIT that would both raise more tax revenue and increase the overall progressivity of the state tax system. This report estimates the revenue increases for four different changes to the PIT, including adding new brackets on high earners and increasing tax rates. We evaluate the impact of a new bracket on those earning over $500,000 annually, two options for moderately more progressive rates on high earners, and one very progressive proposal that has been introduced in both the Senate and Assembly (S2059/A3115). Overall we find that each proposal would raise over $1 billion in revenue annually and only impact the very affluent.
Figure 3 below illustrates the four tax structures (in blue and green) in comparison to the current tax structure (dashed gray). Under the current New York state tax code, an individual making $80,000 annually pays the same tax rate as an individual making $200,000 annually. Likewise, an individual making $300,000 annually pays the same tax rate as an individual making $1 million annually. The chart shows that each of the four proposed tax systems would make an overall more progressive tax landscape, meaning that individuals who make more money in a given year would also pay a higher share of their income in taxes:
- Proposal 1 – New 8% bracket: Adds a new bracket for individuals making between $500,000 and $1.077 million (an increase of 1.15 percent) to evaluate the impact of creating brackets on high earners who are below the “millionaire” brackets.
- Proposal 2 – Increase in top rate: Increases the tax rates on the current top brackets by 1 percent (those making over $1.077 million, $5 million, and $25 million).
- Proposal 3 – Moderately more progressive: Adds 2 new brackets for those making over $500,000 and increases top rate to 14 percent.
- Proposal 4 – Very progressive: Adds 7 new brackets and increases top rates significantly, with a top rate of 25 percent on those earning $20 million per year.
Figure 3. Proposed increases to the personal income tax in New York

We estimate that creating a new 8 percent bracket at $500,000 for single filers adds about $1.3 billion in revenue annually, whereas increasing the top rates would add over $2 billion annually. Proposals 3 and 4 generate between $9.5 and $21.5 billion in new revenue annually by increasing rates on earners making over $500,000 each year.
Table 1. Revenue Estimates for personal income tax proposals in New York

To understand how the new taxes would impact different parts of the income distribution, we first see what the income distribution of tax filers is in New York. Households file their taxes according to their status as single, married, or head of household. The distribution of tax filers by status and income level is shown below. We can see that the modal household income in New York is between $80,000/year and $150,000/year. Almost 60 percent of tax filers in the state report annual income of less than $90,000 and about 98% of tax filers report income less than $500,000. Less than 1 percent of tax filers in New York state report income greater than $1 million.
Figure 4. Distribution of tax-filers in New York by income bracket and household type

To understand how the proposed changes to the PIT would impact taxpayers in New York, we examine the change in tax revenue for each affected income group. For each of the four PIT proposals examined, we plot the change in total taxes paid by each income group. We can see that for the 98% of taxpayers making less than $500,000/year, there will be no change in tax burden. For each of the proposals (other than the proposal that only evaluates a new 8 percent bracket on those earning over $500,000) the majority of the group seeing the largest increase in tax burden would be those making over $10,000,000 in annual income.
Figure 5. Additional revenue raised across income groups by each proposed change

To evaluate the overall tax incidence, we examine the total revenue earned from taxing different income brackets. As shown below, a large and consistent component of each proposal is that there is significant revenue raised from the bottom 98% of the income distribution. We also see that the more progressive proposals draw more revenue from higher earners. Of particular note is the fact that the new 8% bracket proposal raises more from those earning between $500,000 and $1,000,000 than the proposal that raises rates on the very top earners. This feature is by design and represents the different versions of progressivity that could be implemented by state policymakers.
Figure 6. Total revenue raised across income groups for each proposal and the current PIT structure

Table 2. Current Personal Income Tax Brackets

Table 2. Current Personal Income Tax Brackets

Proposed Income Tax Changes
Blue text indicates new rates or brackets


Methodology
These estimates are based on 2019 New York tax data published by the Department of Tax and Finance. This is the most recent data available on tax revenue by income group, besides 2020 which has been deemed unrepresentative because of the Covid-19 pandemic. We inflate revenue numbers according to growth in incomes observed between 2019 and 2022. Revenue estimates also assume an even distribution of taxpayers across the income bins up to the top bins. In the top bins, we use the average reported earnings in the official tax data.
